Mostrando entradas con la etiqueta NASA’s Aqua satellite. Mostrar todas las entradas

miércoles, 12 de julio de 2017

MEDIO AMBIENTE : CIENCIA .- BBC Mundo Noticias .- ¿Hacia dónde se dirige el iceberg que se acaba de separar de la Antártica?

Hola amigos: A VUELO DE UN QUINDE EL BLOG., lo que los científicos habían previsto sucedió, este miércoles 12 de julio, asombró la información de   que se haya desprendido de la Península Antártica un gigantesco iceberg llamado Larsen C, de aproximadamente 6,000 kilómetros cuadrados, y un peso de 1,000 millones de toneladas;  equivalente a la extensión  un pequeño país europeo como Luxemburgo, que flota a la deriva con dirección al Atlántico Sur. Las Agencias Espaciales como NASA, ESA y otros organismos con sus satélites están haciendo un seguimiento de este gigantesca masa de hielo, se ha calculado que no influirá en el aumento  del nivel de las aguas, pero aun así el medio ambiente sufrirá un cambio, con el derretimiento de la masa que será gradual, tomando la información de BBC Mundo Noticias : ".... Según investigadores británicos, estos gigantes de hielo tienen un impacto dramático y pueden alterar incluso los ciclos alimentarios de los animales que habitan la isla.
A esta isla, por ejemplo, llegó el iceberg A-38 en 2004.
"El agua dulce tiene un efecto mensurable en la estructura de la columna de agua", le explicó a la BBC Mark Brandon, oceanógrafo de la Universidad Abierta, en Reino Unido....."
A continuación la información completa de este suceso del medio ambiente....
 
http://www.bbc.com/mundo/noticias-40582110
https://nasasearch.nasa.gov/search?query=Larsen+C&affiliate=nasa&utf8=%E2%9C%93
https://www.nasa.gov/feature/goddard/2017/massive-iceberg-breaks-off-from-antárctica
http://www.esa.int/Our_Activities/Observing_the_Earth/Copernicus/Sentinel-1/Sentinel_satellite_captures_birth_of_behemoth_iceberg
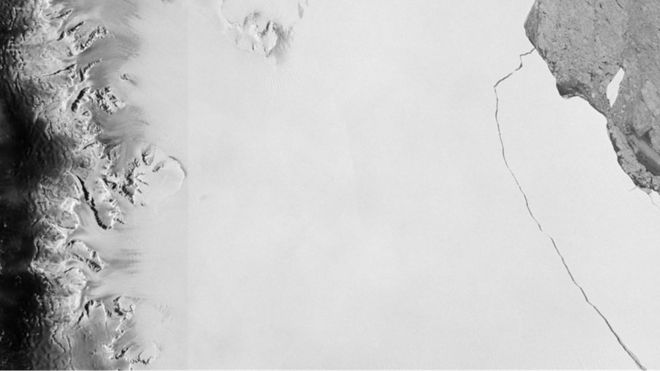
Iceberg que se separó de la Plataforma de Hielo Larsen CDerechos de autor de la imagen ESA
Image caption
                                    La grieta que finalmente dio nacimiento al témpano comenzó a agrandarse en 2014.             

Lo venían anunciado desde hace meses: un gigantesco iceberg de cerca de 6.000 km2 está a punto de desprenderse de la Antártica.
La grieta que mantiene unido a este inmenso bloque de hielo 4 veces más grande que Ciudad de México, 10 que Madrid y equiparable a la mitad de Puerto Rico se está expandiendo, insistían los científicos.
 
Y finalmente, este miércoles, esta enorme masa de hielo de 1 billón de toneladas se separó definitivamente de la Plataforma de Hielo Larsen C.
Ahora que ya cortó sus lazos con la plataforma, ¿qué pasará con el témpano que probablemente recibirá el nombre de A-68?
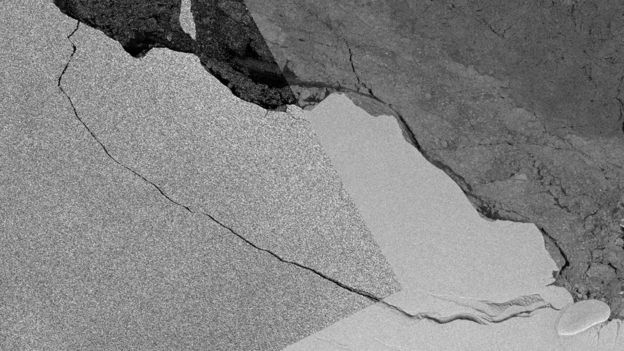
IcebergDerechos de autor de la imagen Copernicus Sentinel (2017) ESA/Andrew Flemming
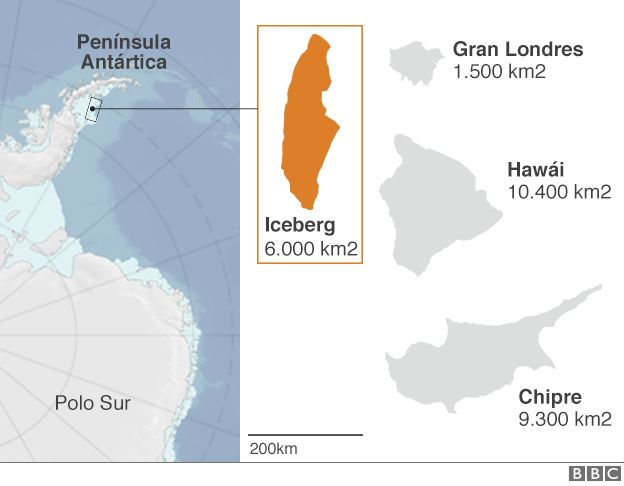
Image caption
                                    El sistema de radar del satélite europeo confirmó también la fractura.
Gráfico de la Antártica

¿Quedará a la deriva en el océano, poniendo en peligro a los barcos que navegan por la región?

Rumbo norte

"El movimiento de los icebergs está controlado mayormente por los vientos de la atmósfera y las corrientes oceánicas que empujan al bloque de hielo que está por debajo de la superficie del agua", le explica a BBC Mundo Anna Hogg, experta en observaciones satelitales de la Universidad de Leeds, en Reino Unido.
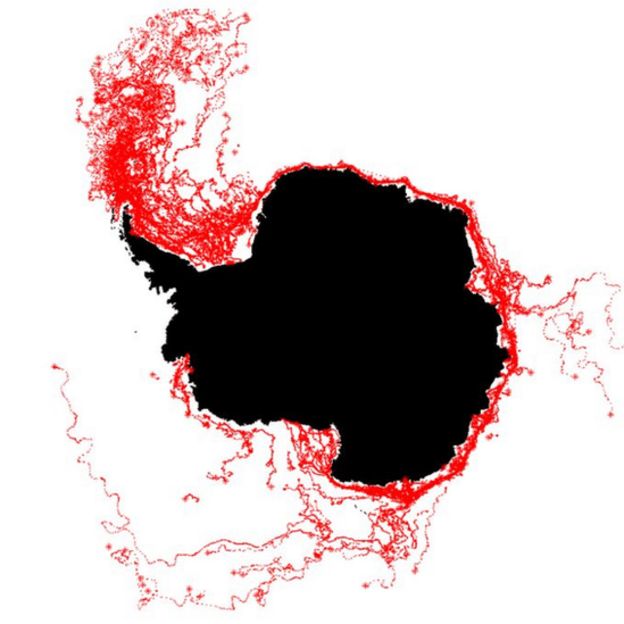
AntárticaDerechos de autor de la imagen Esa
Image caption
                                    Las líneas rojas muestras las rutas tomadas anteriormente por otros témpanos. Por esto todo parece indicar que el iceberg se dirigirá hacia el Atlántico Sur.
La acción del icebergDerechos de autor de la imagen Atlas del Submarine Glacial Landforms
Image caption
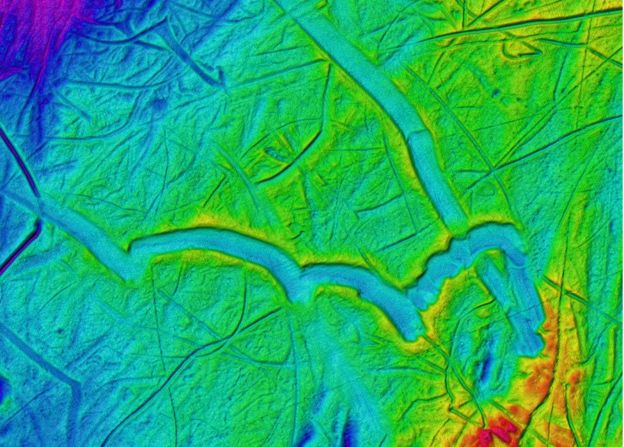
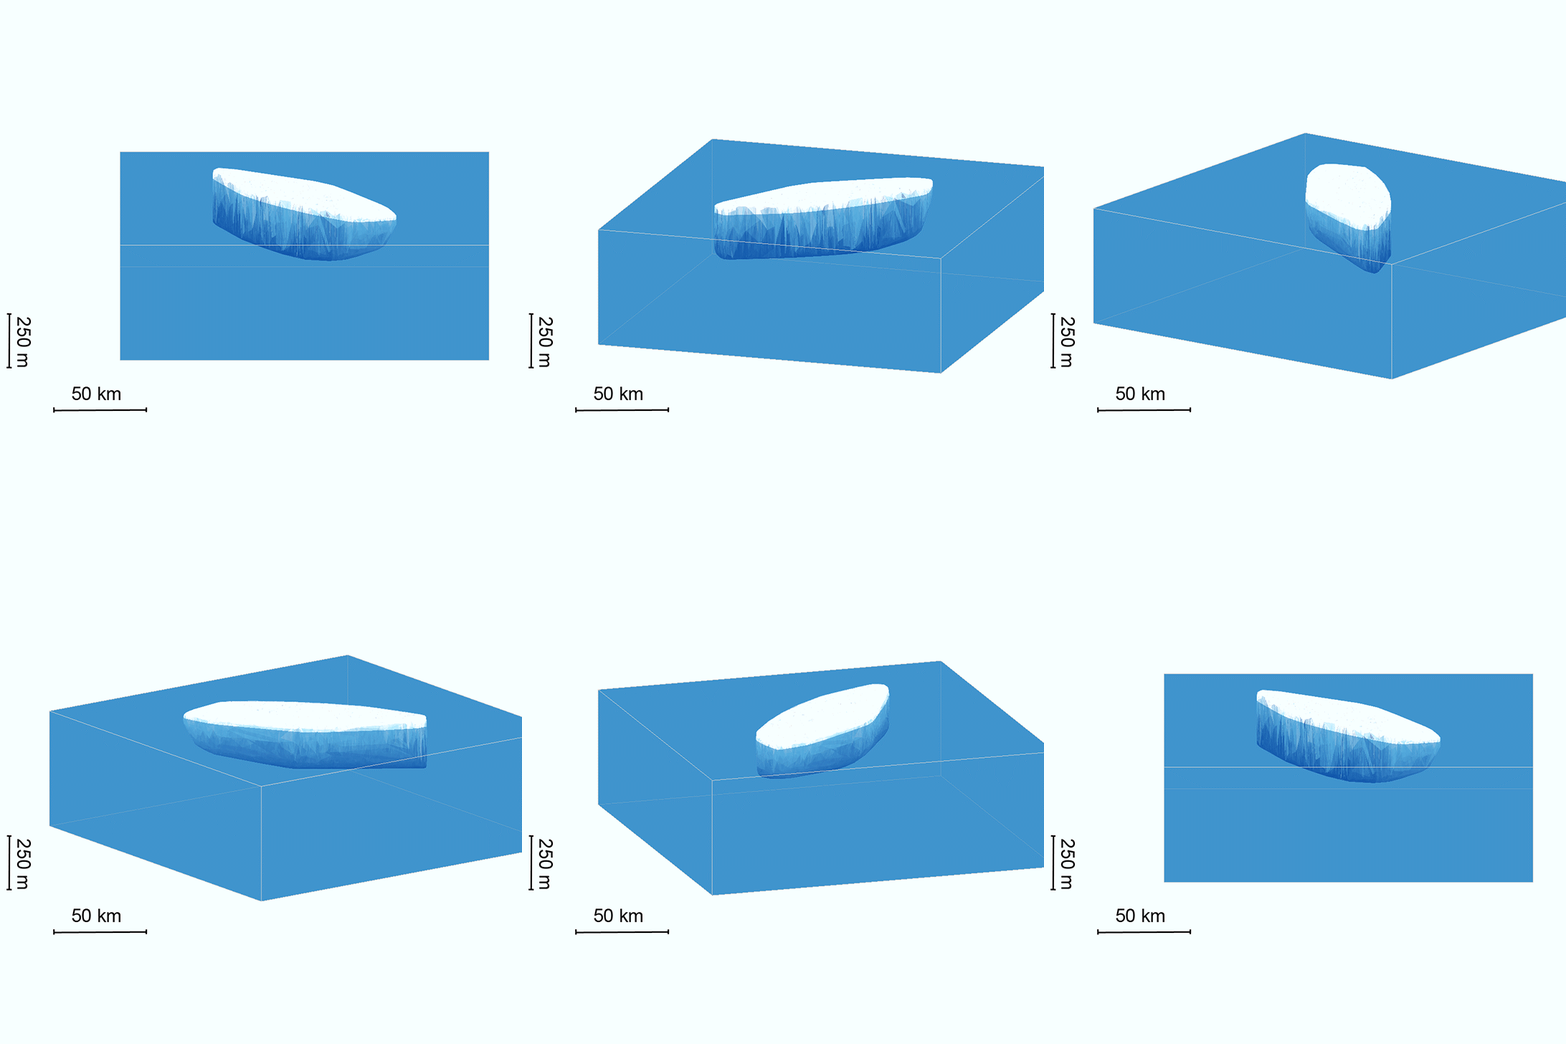
                                    Los icebergs producen canales profundos en el sedimento marino.

Pero también, está determinado por la simetría de lecho marino.
"Los rasgos topográficos importantes, como por ejemplo las pequeñas montañas en el fondo del mar, pueden ser lo suficientemente altas como para hacer que el témpano permanezca en el mismo sitio por un tiempo", dice Hogg.
Si nada lo detiene, o si eventualmente se mueve de su posición original, comenzará a viajar alrededor del continente antártico, impulsado por la corriente costera que gira en sentido contrario a las agujas del reloj y está presente durante todo el año.
Una vez que llegue a la punta de la Península Antártica, "continuará viajando hacia el norte, en dirección al Pasaje de Drake, donde se irá disipando", explica la experta.
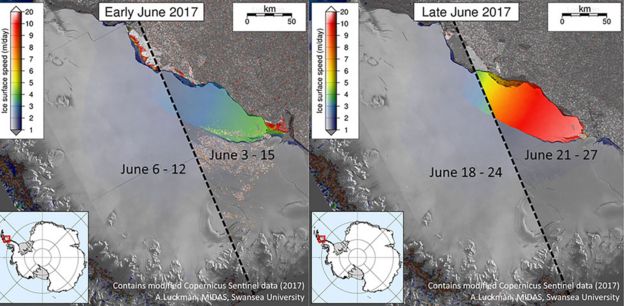
Imagen satelitalDerechos de autor de la imagen AFP
Image caption
                                    Los científicos han estado monitoreando de cerca el desarrollo de la grieta.

Este proceso demora meses, años.
"Semejante volumen de hielo, tomará un buen tiempo en derretirse, sin importar si está en aguas frías o más cálidas", señala Hogg.

Peligro

Los científicos no saben con exactitud hasta dónde llegará, pero normalmente no suele llegar hasta una zona habitada.
Y, a medida que se desplaza hacia el norte, se irá rompiendo en fragmentos más pequeños que pueden continuar su viaje en diferentes direcciones, según las fuerzas que actúen sobre ellos.
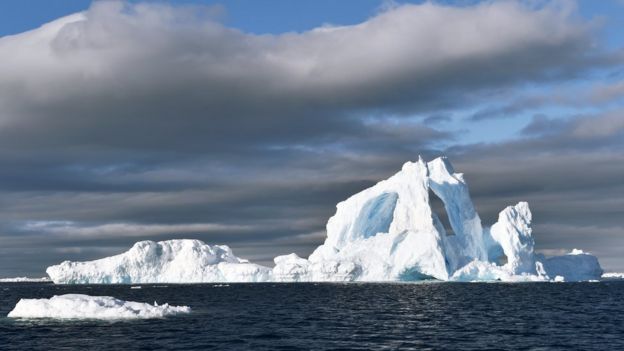
IcebergDerechos de autor de la imagen SPL
Image caption
                                    Cuanto más grande es el iceberg, más fácil es divisarlo a la distancia, y por ende menos peligroso.

Cuando abandone las inmediaciones del continente antártico, es crucial seguirle la pista, ya que es allí donde puede convertirse en un peligro para los navegantes.
No en este momento -en medio del invierno en el sur-, pero sí durante el verano antártico: si bien la península está fuera de las rutas comerciales más importantes, es el principal destino turístico de los cruceros provenientes de América del Sur.
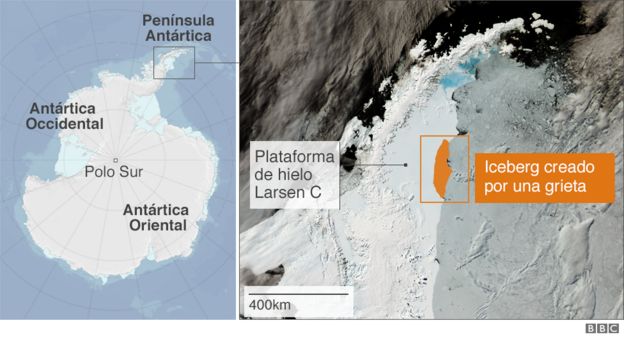
Gráfico de la Antártica
Gráfico

Mientras se mantiene como una sola pieza, o varias pero grandes, es menos peligroso, ya que puede verse a la distancia. Cuando se desmembra la situación empeora, porque desde la superficie es difícil estimar cuánto hielo hay sumergido bajo el agua.

Georgia del Sur

Uno de los lugares donde también suelen acabar los glaciares grandes es en la plataforma de hielo superficial que rodea la isla de Georgia del Sur, unos 1.390 km al este-sureste de las islas Malvinas/Falklands.
Al desarmarse allí, los icebergs vuelcan miles de millones de toneladas de agua dulce en el ambiente marino local.
Según investigadores británicos, estos gigantes de hielo tienen un impacto dramático y pueden alterar incluso los ciclos alimentarios de los animales que habitan la isla.
A esta isla, por ejemplo, llegó el iceberg A-38 en 2004.
"El agua dulce tiene un efecto mensurable en la estructura de la columna de agua", le explicó a la BBC Mark Brandon, oceanógrafo de la Universidad Abierta, en Reino Unido.
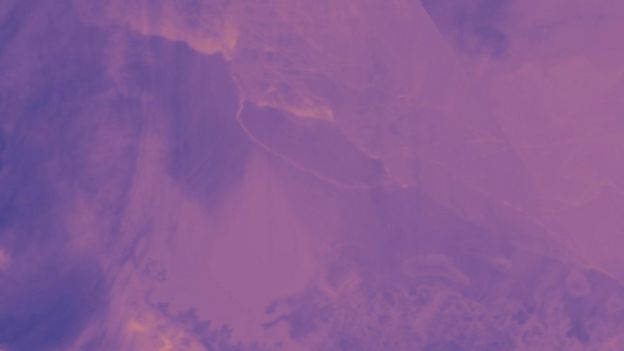
GrietaDerechos de autor de la imagen AQUA / MODIS / NASA
Image caption
                                    Esta imagen de la NASA muestra cómo la grieta se cerró, dejando al iceberg definitivamente separado de la plataforma.

"Cambia las corrientes en la plataforma porque cambia la densidad del agua de mar. Y también baja la temperatura del agua".
El polvo y los fragmentos de roca que el iceberg trajo de Antártica actúan a modo de nutrientes cuando se derriten en el océano e incrementan la productividad de las algas y las diatomeas en la base de la cadena alimentaria.
Pero en Georgia del Sur, estos glaciares pueden tener un impacto negativo al actuar como barrera contra el influjo de kril, una fuente de alimentos vital para muchos animales de la isla, incluidos pingüinos, focas y aves.

Temas relacionados

Contenido relacionado

BBC Mundo Noticias

Información de NASA .-
Massive Iceberg Breaks Off from Antarctica
thermal image of Larsen C ice shelf and iceberg
Thermal wavelength image of a large iceberg, which has calved off the Larsen C ice shelf. Darker colors are colder, and brighter colors are warmer, so the rift between the iceberg and the ice shelf appears as a thin line of slightly warmer area. Image from July 12, 2017, from the MODIS instrument on NASA's Aqua satellite.
Credits: NASA Worldview
 
An iceberg about the size of the state of Delaware split off from Antarctica’s Larsen C ice shelf sometime between July 10 and July 12. The calving of the massive new iceberg was captured by the Moderate Resolution Imaging Spectroradiometer on NASA’s Aqua satellite, and confirmed by the Visible Infrared Imaging Radiometer Suite instrument on the joint NASA/NOAA Suomi National Polar-orbiting Partnership (Suomi-NPP) satellite. The final breakage was first reported by Project Midas, an Antarctic research project based in the United Kingdom.
 
animation of satellite view of Larsen C ice shelf crack
Animation of the growth of the crack in the Larsen C ice shelf, from 2006 to 2017, as recorded by NASA/USGS Landsat satellites.
Credits: NASA/USGS Landsat

Larsen C, a floating platform of glacial ice on the east side of the Antarctic Peninsula, is the fourth largest ice shelf ringing Earth’s southernmost continent. In 2014, a crack that had been slowly growing into the ice shelf for decades suddenly started to spread northwards, creating the nascent iceberg. Now that the close to 2,240 square-mile (5,800 square kilometers) chunk of ice has broken away, the Larsen C shelf area has shrunk by approximately 10 percent.

satellite view of Larsen C ice shelf crack
Throughout the sunlit months of late 2016 and early 2017, scientists watched closely as a crack grew across the Larsen C ice shelf on the Antarctic Peninsula. On June 17, 2017, the Thermal Infrared Sensor (TIRS) on Landsat 8 captured a false-color image of the crack and the surrounding ice shelf. It shows the relative warmth or coolness of the landscape. Orange depicts where the surface is the warmest, most notably the areas of open ocean and of water topped by thin sea ice. Light blues and whites are the coldest areas, spanning most of the ice shelf and some areas of sea ice. Dark blue and purple areas are in the mid-range.
Credits: NASA's Earth Observatory
satellite view of Larsen C ice shelf crack
The blue hue of the crack indicates that relatively warm ocean water is not far below the ice surface. No part of the crack appears as warm as ocean areas, likely because there is a soup of floating, broken ice pieces from the rift’s walls and bits of sea ice sitting atop the water-filled crack. (This mixture can act as a weak glue, but it also prevents the rift from healing.)
Credits: NASA's Earth Observatory
 
“The interesting thing is what happens next, how the remaining ice shelf responds,” said Kelly Brunt, a glaciologist with NASA’s Goddard Space Flight Center in Greenbelt, Maryland, and the University of Maryland in College Park. “Will the ice shelf weaken? Or possibly collapse, like its neighbors Larsen A and B? Will the glaciers behind the ice shelf accelerate and have a direct contribution to sea level rise? Or is this just a normal calving event?”

Ice shelves fringe 75 percent of the Antarctic ice sheet. One way to assess the health of ice sheets is to look at their balance: when an ice sheet is in balance, the ice gained through snowfall equals the ice lost through melting and iceberg calving. Even relatively large calving events, where tabular ice chunks the size of Manhattan or bigger calve from the seaward front of the shelf, can be considered normal if the ice sheet is in overall balance. But sometimes ice sheets destabilize, either through the loss of a particularly big iceberg or through disintegration of an ice shelf, such as that of the Larsen A Ice Shelf in 1995 and the Larsen B Ice Shelf in 2002. When floating ice shelves disintegrate, they reduce the resistance to glacial flow and thus allow the grounded glaciers they were buttressing to significantly dump more ice into the ocean, raising sea levels.

Scientists have monitored the progression of the rift throughout the last year was using data from the European Space Agency Sentinel-1 satellites and thermal imagery from NASA’s Landsat 8 spacecraft. Over the next months and years, researchers will monitor the response of Larsen C, and the glaciers that flow into it, through the use of satellite imagery, airborne surveys, automated geophysical instruments and associated field work.


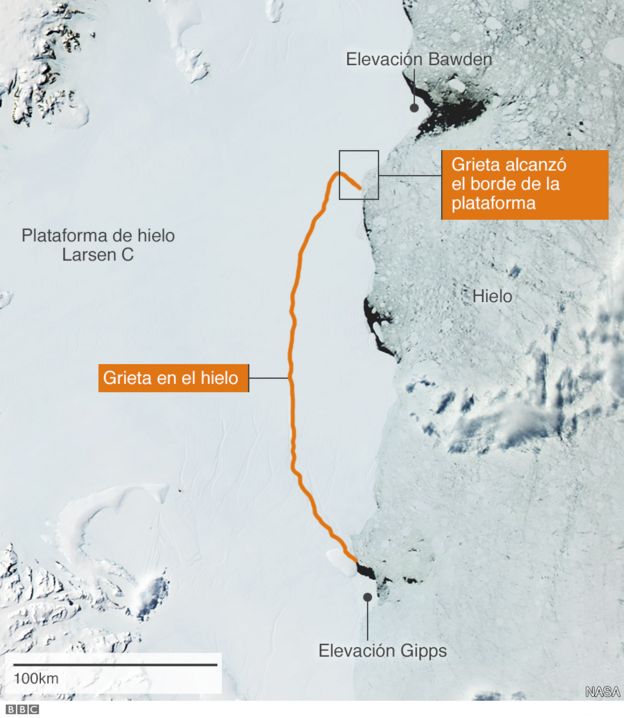
In the case of this rift, scientists were worried about the possible loss of a pinning point that helped keep Larsen C stable. In a shallow part of the sea floor underneath the ice shelf, a bedrock protrusion, named the Bawden Ice Rise, has served as an anchor point for the floating shelf for many decades. Ultimately, the rift stopped short of separating from the protrusion.

“The remaining 90 percent of the ice shelf continues to be held in place by two pinning points: the Bawden Ice Rise to the north of the rift and the Gipps Ice Rise to the south,” said Chris Shuman, a glaciologist with Goddard and the University of Maryland at Baltimore County. “So I just don’ see any near-term signs that this calving event is going to lead to the collapse of the Larsen C ice shelf. But we will be watching closely for signs of further changes across the area.”

The first available images of Larsen C are airborne photographs from the 1960s and an image from a US satellite captured in 1963. The rift that has produced the new iceberg was already identifiable in those pictures, along with a dozen other fractures. The crack remained dormant for decades, stuck in a section of the ice shelf called a suture zone, an area where glaciers flowing into the ice shelf come together. Suture zones are complex and more heterogeneous than the rest of the ice shelf, containing ice with different properties and mechanical strengths, and therefore play an important role in controlling the rate at which rifts grow. In 2014, however, this particular crack started to rapidly grow and traverse the suture zones, leaving scientists perplexed.

“We don’t currently know what changed in 2014 that allowed this rift to push through the suture zone and propagate into the main body of the ice shelf,” said Dan McGrath, a glaciologist at Colorado State University who has been studying the Larsen C ice shelf since 2008.

McGrath said the growth of the crack, given our current understanding, is not directly linked to climate change.

“The Antarctic Peninsula has been one of the fastest warming places on the planet throughout the latter half of the 20th century. This warming has driven really profound environmental changes, including the collapse of Larsen A and B,” McGrath said. “But with the rift on Larsen C, we haven’t made a direct connection with the warming climate. Still, there are definitely mechanisms by which this rift could be linked to climate change, most notably through warmer ocean waters eating away at the base of the shelf.”

While the crack was growing, scientists had a hard time predicting when the nascent iceberg would break away. It’s difficult because there are not enough measurements available on either the forces acting on the rift or the composition of the ice shelf. Further, other poorly observed external factors, such as temperatures, winds, waves and ocean currents, might play an important role in rift growth. Still, this event has provided an important opportunity for researchers to study how ice shelves fracture, with important implications for other ice shelves.

The U.S. National Ice Center will monitor the trajectory of the new iceberg, which is likely to be named A-68. The currents around Antarctica generally dictate the path that the icebergs follow. In this case, the new berg is likely to follow a similar path to the icebergs produced by the collapse of Larsen B: north along the coast of the Peninsula, then northeast into the South Atlantic.

“It’s very unlikely it will cause any trouble for navigation,” Brunt said.

By Maria-Jose Viñas
NASA’s Earth Science Team

Additional media contact: Rani Gran, NASA's Goddard Space Flight Center, Greenbelt, Md.
Last Updated: July 12, 2017
Editor: Rob Garner

 
NASA
 
INFORMACIÓN DE LA AGENCIA ESPACIAL EUROPEA - ESA .-

Sentinel satellite captures birth of behemoth iceberg


Larsen C breaks
 
12 July 2017
Over the last few months, a chunk of Antarctica’s Larsen C ice shelf has been hanging on precariously as a deep crack cut across the ice. Witnessed by the Copernicus Sentinel-1 mission, a lump of ice more than twice the size of Luxembourg has now broken off, spawning one of the largest icebergs on record and changing the outline of the Antarctic Peninsula forever.
The fissure first appeared several years ago, but seemed relatively stable until January 2016, when it began to lengthen.
In January 2017 alone it travelled 20 km, reaching a total length of about 175 km.
After a few weeks of calm, the rift propagated a further 16 km at the end of May, and then extended further at the end of June.
More importantly, as the crack grew, it branched off towards the edge of the shelf, whereas before it had been running parallel to the Weddell Sea.
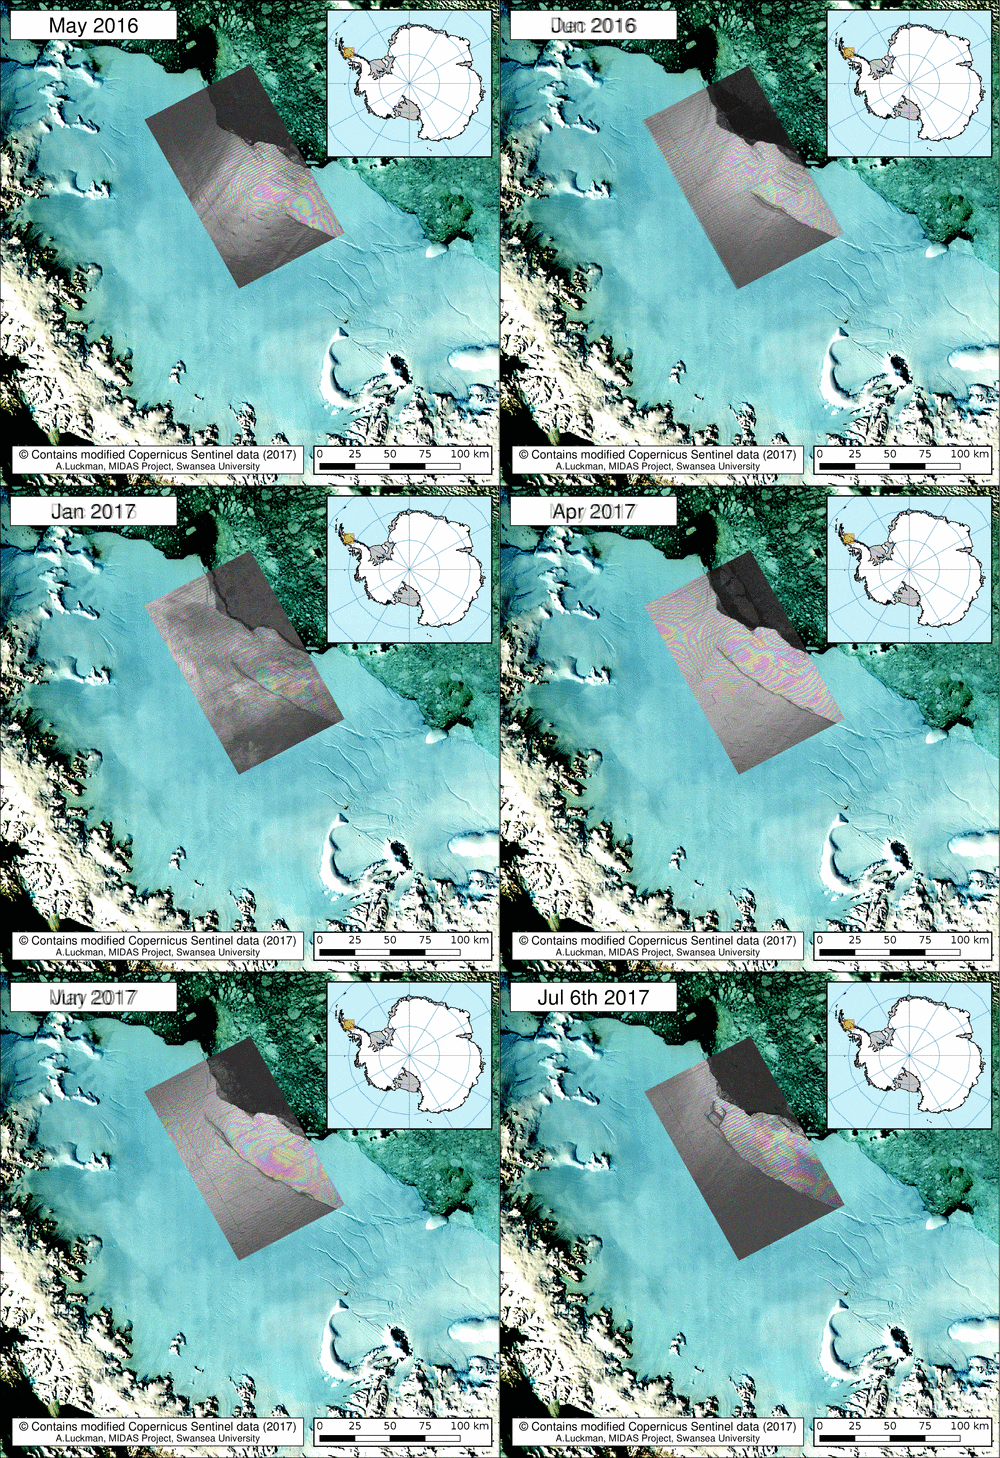
 

Monitoring the rift

With just a few km between the end of the fissure and the ocean by early July, the fate of the shelf was sealed.
Scientists from Project MIDAS, an Antarctic research consortium led by Swansea University in the UK, used radar images from the Copernicus Sentinel-1 mission to keep a close eye on the rapidly changing situation.
Since Antarctica is heading into the dark winter months, radar images are indispensable because, apart from the region being remote, radar continues to deliver images regardless of the dark and bad weather
Adrian Luckman, leading MIDAS, said, “The recent development in satellite systems like Sentinel-1 has vastly improved our ability to monitor events such as this.”
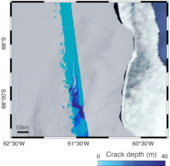
 

Depth of ice crack
Noel Gourmelen from the University of Edinburgh added. “We have been using information from ESA’s CryoSat mission, which carries a radar altimeter to measure the surface height and thickness of the ice, to reveal that the crack was several tens of metres deep.”
As predicted, a section of Larsen C – about 6000 sq km – finally broke away as part of the natural cycle of iceberg calving. The behemoth iceberg weighs more than a million million tonnes and contains about the same amount of water as Lake Ontario in North America.
“We have been expecting this for months, but the rapidity of the final rift advance was still a bit of a surprise. We will continue to monitor both the impact of this calving event on the Larsen C ice shelf, and the fate of this huge iceberg,” added Prof. Luckman.
The iceberg’s progress is difficult to predict. It may remain in the area for decades, but if it breaks up, parts may drift north into warmer waters. Since the ice shelf is already floating, this giant iceberg does not influence sea level.
 

Ice crack seen by Sentinel-2A
With the calving of the iceberg, about 10% of the area of the ice shelf has been removed.
The loss of such a large piece is of interest because ice shelves along the peninsula play an important role in ‘buttressing’ glaciers that feed ice seaward, effectively slowing their flow.
Previous events further north on the Larsen A and B shelves, captured by ESA’s ERS and Envisat satellites, indicate that when a large portion of an ice shelf is lost, the flow of glaciers behind can accelerate, contributing to sea-level rise.
Thanks to Europe’s Copernicus environmental monitoring programme, we have the Sentinel satellites to deliver essential information about what’s happening to our planet. This is especially important for monitoring remote inaccessible regions like the poles.
ESA’s Mark Drinkwater said, “Having the Copernicus Sentinels in combination with research missions like CryoSat is essential for monitoring ice volume changes in response to climate warming.
“In particular, the combination of year-round data from these microwave-based satellite tools provides critical information with which to understand ice-shelf fracture mechanics and changes in dynamic integrity of Antarctic ice shelves.”
 

Related articles


ESA
Guillermo Gonzalo Sánchez Achutegui

jueves, 8 de diciembre de 2016

NASA : Oceanic Nonlinear Internal Solitary Waves From the Lombok Strait .- Olas oceánicas no lineales solitarias internas del estrecho de Lombok

https://www.nasa.gov/image-feature/oceanic-nonlinear-internal-solitary-waves-from-the-lombok-strait

Waves and sunglint around small islands imaged from orbit by satellite
On November 1, 2016,  passed over Indonesia, allowing the Moderate Resolution Imaging Spectroradiometer (MODIS) on board to capture a stunning true-color image of oceanic nonlinear internal solitary waves from .
A bank of clouds covers East Java along the western edge of the image, with a bright sun overhead casting shadows from the clouds along the ocean surface. Away from the clouds, the ocean surface appears a bright silver due to “sunglint”, an optical effect caused by the mirror-like reflection of sunlight off the water surface directly back at the satellite sensor. Although sunglint washes out many features, it also reveals details about the water surface that are usually hidden from view. In this case, sunglint exposes created by the movement of currents in the ocean water.
Internal waves are generated when the interface between layers is disturbed, such as when tidal flow passes over rough ocean floors, ridges, or other obstacles. The Lombok Strait, which is a relatively narrow passageway between Bali (west) and Lombok (east), allows flow of water from the Pacific Ocean into the Indian Ocean. The bottom of the strait is complex and rough, consisting of two main channels, one shallow and one deep. Because of the variation in water movement due to the complexity of the channels and ocean interface, the tides in the strait have a complex rhythm but tend to combine about every 14 days to create an exceptionally strong tidal flow. It is the combination of rough topography, strong tidal currents, and stratified water from the ocean exchange that makes the Lombok Strait famous for generation of intensive internal waves.
Image Credit: Jeff Schmaltz, MODIS Land Rapid Response Team, NASA GSFC
Last Updated: Dec. 7, 2016
Editor: Marc Levy
NASA a vuelo
Guillermo Gonzalo Sánchez Achutegui
ayabaca@gmail.com
ayabaca@hotmail.com
ayabaca@yahoo.com
Inscríbete en el Foro del blog y participa : A Vuelo De Un Quinde - El Foro!

viernes, 7 de octubre de 2016

NASA : Hurricane Matthew Hits Haiti .- Huracán Mateo azota Haití

http://www.nasa.gov/image-feature/hurricane-matthew-hits-haiti

Satellite image of Hurricane Matthew over Haiti
On October 4, 2016,
Hurricane Matthew made landfall on southwestern Haiti as a category-4 storm—the strongest storm to hit the Caribbean nation in more than 50 years. Just hours after landfall, the Moderate Resolution Imaging Spectroradiometer (MODIS) on NASA’s Terra satellite acquired this natural-color image. At the time, Matthew had top sustained winds of about 230 kilometers (145 miles) per hour.
 
Earlier on October 4, temperature data collected by MODIS on NASA’s Aqua satellite revealed that the cloud tops around Matthew were very cold (at least -57° Celsius, or -70° Fahrenheit). Cold cloud tops are known to produce heavy rainfall. The National Hurricane Center called for 380 to 500 millimeters (15 to 20 inches) of rain in Southern Haiti and in the southwestern Dominican Republic.
 
The interaction with land could weaken the storm somewhat, but wind patterns in the upper atmosphere and the warm water in the tropical Atlantic should help maintain Matthew’s hurricane strength for the rest of the week. The specific path of the storm as it approaches the United States is not yet certain. A direct impact on Florida or the Carolinas remains possible.
NASA Earth Observatory image by Joshua Stevens, using MODIS data from the Land Atmosphere Near real-time Capability for EOS (LANCE)
Caption: Kathryn Hansen
Last Updated: Oct. 5, 2016
Editor: Sarah Loff
Tags:  Earth, Hurricanes, Image of the Day, Terra Satellite,
NASA
Guillermo Gonzalo Sánchez Achutegui
Inscríbete en el Foro del blog y participa : A Vuelo De Un Quinde - El Foro!

NASA : A Trio of Plumes in the South Sandwich Islands .- Un trío de penachos en las Islas Sandwich del Sur

http://www.nasa.gov/image-feature/a-trio-of-plumes-in-the-south-sandwich-islands

Infrared satellite image of volcanic plumes over islands
On September 29, 2016, the Moderate Resolution Imaging Spectroradiometer (MODIS) on NASA’s Aqua satellite captured this false-color image (MODIS bands 7-2-1) showing volcanic activity in the South Sandwich Islands.
Located in the South Atlantic Ocean, the uninhabited South Sandwich Islands include several active stratovolcanoes. Due to their remote location, these volcanoes are some of the least studied in the world, though satellites often catch them erupting.
The combination of clouds and ice can make it difficult to see plumes of volcanic ash in natural color imagery. Using portions of the electromagnetic spectrum that are typically invisible to the naked eye—such as infrared—enables satellites to distinguish ice from ash and clouds, or even reveal hot spots underneath a smoky wildfire.
Annotated image: NASA's Earth Observatory
Image Credit: NASA Earth Observatory image by Joshua Stevens, using MODIS data from the Land Atmosphere Near real-time Capability for EOS (LANCE)
Caption: Joshua Stevens

Last Updated: Oct. 3, 2016
Editor: Sarah Loff
Tags:  Aqua Satellite, Earth, Hazards, Image of the Day,
NASA
Guillermo Gonzalo Sánchez Achutegui
Inscríbete en el Foro del blog y participa : A Vuelo De Un Quinde - El Foro!

domingo, 20 de diciembre de 2015

NASA | Observing the 2015 El Niño.- Observando el Fenómeno de El Niño en 2015


People the world over are feeling, or soon will feel, the effects of the strongest El Niño event since 1997-98, currently unfolding in the eastern equatorial Pacific Ocean. New satellite observations are beginning to show scientists its impact on the distribution of rain, tropospheric ozone and wildfires around the globe.
Credits: NASA
 

One big question about the current El Niño is whether it will bring significant rainfall to drought-plagued California. Researchers studying storms and their relationship to strong El Niños believe it will.

Duane Waliser, chief scientist of the Earth Science and Technology Directorate at NASA's Jet Propulsion Laboratory in Pasadena, California, and his colleagues analyzed the historical record of atmospheric rivers. These concentrated rain bands account for 40 percent of California's water supply. Their results suggest the number of atmospheric rivers California receives will remain the same, at an average 10 per year, but they will be stronger, warmer and wetter.

"Overall we'll likely get more precipitation, but maybe less in terms of snowfall," Waliser said, adding that they may contribute to more flooding.

It’s the strength of the El Niño that determines its impact on total rainfall in California, said Martin Hoerling, a research meteorologist with the Earth Systems Research Laboratory at the National Oceanic and Atmospheric Administration in Boulder, Colorado. His group ran a statistical analysis of the relationship between past El Niño strength and precipitation.

"What we learned is weak El Niños don't necessarily change the odds of precipitation being much different from normal," said Hoerling. "The rare occurrence of a strong El Niño, like what we're currently experiencing, however, greatly increases the odds of a wet California winter."

El Niño's elevated sea surface temperatures shift rain patterns by affecting the temperature of the air above the ocean, which alters how winds and air masses circulate air around the planet.

The change in winds also affects the distribution of tropospheric ozone around the planet. Tropospheric ozone exists in the atmospheric layer closest to the surface and comprises ozone produced naturally and from human pollution. Ozone in the troposphere is a greenhouse gas and a health hazard. Understanding El Niño's influence on ozone concentration is important for understanding the atmosphere's response to natural variation and distinguishing natural changes from human causes.

Mark Olsen, an atmospheric research scientist at Morgan State University in Baltimore and NASA's Goddard Space Flight Center in Greenbelt, Maryland, and his colleagues produced the first near-global map of ozone sensitivity caused by El Niño and La Niña events. Previous work showed that El Niño events cause a strong change in ozone in the tropics. Olsen's new work uses satellite data combined with a computer model to show that a smaller but still significant effect occurs in the mid-latitudes.

"El Niño is just one factor in the variability," Olsen said. "But you do see regions like the central United States where El Niño explains 20 to 25 percent of the variability."

Ozone in this region tends to decrease where El Niño-driven changes to local wind circulation patterns causes them to draw air upward. According to Olsen, it's a large enough influence that El Niño does need to be considered if you want to attribute causes of ozone concentration changes and long-term trends.

Jim Randerson, Earth system scientist at the University of California, Irvine, and his team analyzed wildfire burned area maps from satellite data to study how El Niño-driven effects change the distribution and severity of wildfires worldwide. During El Niños, the number and size of fires increases in tropical forests across Asia and South America.

"The change in atmospheric dynamics shifts the rainfall," Randerson said. "So El Niño causes less rain to fall in many areas of the tropics, making forests more vulnerable to human-ignited fires."
 
monthly average of global burned area for August 2015
Shown here is the monthly average of global burned area for August 2015, produced from data from the Moderate Resolution Imaging Spectroradiometer (MODIS) aboard NASA’s Aqua satellite. Light blue indicates a small percentage of burned area, while red and orange indicate high percentages of burned area.
Credits: NASA

Fires in tropical forests also accelerate carbon dioxide buildup in the atmosphere and reduce air quality. Indonesia, for example, has carbon-rich peatlands that ignite as soon as the rain stops, which is what happened this fall, Randerson said. Meanwhile, Southeast Asia, Central America, and the southern Amazon have very high fire risk for 2016. El Niño tends to reduce rainfall in their wet seasons, and less rain means drier vegetation and drier air, which make forests vulnerable to dry season burning.
NASA uses the vantage point of space to increase our understanding of our home planet, improve lives, and safeguard our future. NASA develops new ways to observe and study Earth's interconnected natural systems with long-term data records. The agency freely shares this unique knowledge and works with institutions around the world to gain new insights into how our planet is changing.

For more information on El Niño and NASA’s Earth-observing missions, visit:


-end-
Steve Cole
Headquarters, Washington
202-358-0918
stephen.cole@nasa.gov

Ellen Gray
Goddard Space Flight Center, Greenbelt, Md.
301-286-1950 / 301-502-4064
ellen.t.gray@nasa.gov
Last Updated: Dec. 15, 2015
Editor: Karen Northon
NASA
Guillermo Gonzalo Sánchez Achutegui
Incríbete en el Foro del blog y participa : A Vuelo De Un Quinde - El Foro!

domingo, 8 de noviembre de 2015

NASA : Tropical Cyclone Chapala Over the Gulf of Aden .- El Ciclón tropical Chapala sobre el Golfo de Adén

Hola amigos: A VUELO DE UN QUINDE EL BLOG., El Ciclón tropical Chapala tocó tierra en la parte continental de Yemen temprano el 3 de noviembre de 2015, el dumping lluvias torrenciales a través del paisaje árido. Las estimaciones de los vientos máximos sostenidos en el momento de tocar tierra variaron en cierta medida, pero se reportaron a 130 km / h (80,1 mph) con ráfagas a 145 km / h (90 mph), lo que es una tormenta de categoría 1 en el viento de Saffir-Simpson de Huracanes escala. Esto significa que Chapala es la primera tormenta del huracán-fuerza en el expediente que toque tierra en Yemen.
Estos vientos fuertes se puede esperar que dejar daños detrás, pero por esta tormenta, el principal daño es causado por las lluvias torrenciales en una región muy seca. Mientras Yemen normalmente recibe alrededor de 4 pulgadas (100 ml) por la lluvia cada año, es probable que deje caer dos o tres veces esa cantidad. A partir de la tarde del 03 de noviembre, las evaluaciones iniciales de daños están comenzando a hacerse mientras la tormenta comienza a disiparse sobre la tierra. Las fuertes inundaciones se ha informado, incluso en Mukalla, la quinta ciudad más grande del país.
El Moderate Resolution Imaging Spectroradiometer (MODIS) a bordo del satélite Aqua de la NASA capturó esta imagen en color verdadero del ciclón Chapala sobre el Golfo de Adén, el 2 de noviembre de 2015, a las 12:40 pm hora local (0940 GMT). En el momento en que la imagen fue adquirida, los vientos máximos sostenidos de Chapala fueron 120 mph (195 km / h), el equivalente a un huracán de categoría 3.
More information.............

Tropical Cyclone Chapala made landfall on mainland Yemen early on November 3, 2015, dumping torrential rains.
Tropical Cyclone Chapala made landfall on mainland Yemen early on Nov. 3, 2015, dumping torrential rains across the arid landscape. Estimates of maximum sustained winds at time of landfall varied to some degree but were reported at 130 km/h (80.1 mph) with gusts to 145 km/h (90 mph), making it a Category 1 storm on the Saffir-Simpson Hurricane wind scale. This means that Chapala is the first hurricane-strength storm on record to make landfall in Yemen.
Such strong winds can be expected to leave damage behind, but for this storm, the major damage is being caused by torrential rainfall in a very dry region. While Yemen typically receives about 4 in (100 ml) per rain each year, it is likely to drop two to three times that amount. As of the evening of Nov. 3, initial damage assessments are just beginning to be made as the storm begins to dissipate over land. Heavy flooding has been reported, including in Mukalla, the country’s fifth-largest city.
The Moderate Resolution Imaging Spectroradiometer (MODIS) aboard NASA’s Aqua satellite captured this true-color image of Cyclone Chapala over the Gulf of Aden on Nov. 2, 2015, at 12:40 p.m. local time (0940 UTC). At the time the image was acquired, Chapala’s maximum sustained winds were 120 mph (195 km/h), the equivalent of a Category 3 hurricane.
Image Credit: NASA/MODIS/Jeff Schmaltz
Last Updated: Nov. 4, 2015
Editor: Steve Fox
NASA
Guillermo Gonzalo Sánchez Achutegui
ayabaca@gmail.com
ayabaca@hotmail.com
ayabaca@yahoo.com
Inscríbete en el Foro del blog y participa : A Vuelo De Un Quinde - El Foro!

martes, 25 de agosto de 2015

NASA : Sea Ice in the Greenland Sea .- Hielo marino en el Mar de Groenlandia

Hola mis amigos: A VUELO DE UN QUINDE EL BLOG., A medida que el Hemisferio Norte experimenta el calor del verano, el hielo se mueve y se deshace en las aguas del Ártico y las tierras más al norte que lo rodean. El Moderate Resolution Imaging Spectroradiometer (MODIS) a bordo del satélite Aqua de la NASA captó esta imagen en color verdadero de hielo del mar de Groenlandia el 16 de julio de 2015.
Grandes trozos de derretimiento del hielo marino se pueden ver en el hielo del mar frente a la costa, y las espirales al sur de hielo han sido moldeadas por los vientos y las corrientes que se mueven a través del Mar de Groenlandia. A lo largo de la costa de Groenlandia, el frío, el agua fresca fusión de los glaciares fluye hacia el mar, al igual que los icebergs recién parido. Aire frío del interior de Groenlandia empuja el hielo lejos de la costa, y la mezcla de agua fría y aire permite un poco de hielo mar para sostenerse incluso en pleno verano.
Según las observaciones de los satélites, 2015 está en camino de ser otro año de baja para la cubierta de hielo marino del verano ártico. Los últimos diez años han incluido nueve de la extensión de hielo más bajas de la historia. El mínimo anual se produce normalmente a finales de agosto o principios de septiembre. La cantidad de la cubierta de hielo marino del Ártico ha disminuido ya que las temperaturas globales aumentan. El Ártico es de dos a tres veces más sensibles a los cambios de temperatura como la Tierra en su conjunto.
 
More information......

Swirls of sea ice along the coast and dark blue waters of the Arctic
As the northern hemisphere experiences the heat of summer, ice moves and melts in the Arctic waters and the far northern lands surrounding it. The Moderate Resolution Imaging Spectroradiometer (MODIS) aboard NASA’s Aqua satellite captured this true-color image of sea ice off Greenland on July 16, 2015.
 
Large chunks of melting sea ice can be seen in the sea ice off the coast, and to the south spirals of ice have been shaped by the winds and currents that move across the Greenland Sea. Along the Greenland coast, cold, fresh melt water from the glaciers flows out to the sea, as do newly calved icebergs. Frigid air from interior Greenland pushes the ice away from the shoreline, and the mixing of cold water and air allows some sea ice to be sustained even at the height of summer.
According to observations from satellites, 2015 is on track to be another low year for arctic summer sea ice cover. The past ten years have included nine of the lowest ice extents on record. The annual minimum typically occurs in late August or early September. The amount of Arctic sea ice cover has been dropping as global temperatures rise. The Arctic is two to three times more sensitive to temperature changes as the Earth as a whole.
Image Credit: NASA/Jeff Schmaltz, MODIS Land Rapid Response Team, NASA GSFC
Last Updated: Aug. 24, 2015
Editor: Sarah Loff
Tags:  Aqua Satellite, Climate, Earth, Ice, Image of the Day,
NASA
Guillermo Gonzalo Sánchez Achutegui

sábado, 21 de junio de 2014

NASA : Phytoplankton Bloom Off the Coast of Iceland


Phytoplankton Bloom Off the Coast of Iceland
A spring bloom of phytoplankton lingered in the Atlantic Ocean off the coast of Iceland in early June, 2014. The Moderate Resolution Imaging Spectroradiometer (MODIS) aboard NASA’s Aqua satellite captured this true-color image on June 5. At that time, swirling jewel tones of a vast bloom were visible between banks of white clouds.
According to the Icelandic Ministry of Fisheries and Agriculture, phytoplankton blooms around Iceland usually occur in early spring and fall. The spring bloom is driven by longer daylight and the warming of surface layers. This leads to stratification of the waters, and allows the phytoplankton to stay in the surface layer and reproduce. By summer the huge numbers of phytoplankton in the blooms decreases nutrients, and the numbers of the organisms begins to plummet.
Image Credit: NASA/Jeff Schmaltz, MODIS Land Rapid Response Team, NASA GSFC
NASA
Guillermo Gonzalo Sánchez Achutegui
ayabaca@gmail.com
ayabaca@Hotmail.com
ayabaca@yahoo.com
Inscríbete en el Foro del blog y participa : A Vuelo De Un Quinde - El Foro!

jueves, 1 de mayo de 2014

NASA : Volcanic Plume Over Southern Atlantic Ocean Revealed Through False-Color Imagery


Volcanic Plume Over Southern Atlantic Ocean Revealed Through False-Color Imagery
The South Sandwich Islands, in the far southern Atlantic Ocean, are often shrouded with thick cloud, making it difficult to view the region from space. Sometimes, however, the use of false-color imagery can be used to reveal events that would otherwise be obscured under cloud cover.
The Moderate Resolution Imaging Spectroradiometer (MODIS) aboard NASA’s Aqua satellite flew over the South Sandwich Islands on April 19, 2014 and acquired this false-color image of the cloudy scene.
This false-color image uses a combination of non-visible (middle infrared and infrared) and visible (red) light captured in bands 7, 2, and 1, respectively, to distinguish clouds from snow and ice. Here the ice-covered islands appear bright turquoise, the clouds light turquoise and the water in the ocean appears deep black. Because the volcanic plume is a moist mixture of gas and ash, it reflects all three forms of light relatively well, so it appears nearly white.
In the north of this image, a thin plume of white rises from the volcano on Zavodovski island, the northernmost of the South Sandwich Islands and streams to the northeast. Further south, a wider white plume can be seen blowing across the Atlantic Ocean. This plume rises from the Mount Michael volcano, which is a young and frequently active stratovolcano located on Saunders Island, near the center of the South Sandwich Island chain.
The white plume from Mount Michael forms a chain of swirling eddies as it blows to the northeast. To the south, similar eddies can be seen behind three other islands. These are known as Von Kármán vortices. These vortices can form nearly anywhere that fluid flow is disturbed by an object. Because the atmosphere behaves like a fluid, when streaming air hits a blunt object, such as a mountain peak, the wind is forced around the object. The disturbance in the flow of the wind propagates downstream in a double row of vortices that alternate their direction of rotation, much like the eddies seen behind a pier in a river as water rushes past.
Image Credit: Jeff Schmaltz/MODIS Land Rapid Response Team, NASA GSFC

NASA
Guillermo Gonzalo Sánchez Achutegui
ayabaca@gmail.com
ayabaca@hotmail.com
ayabaca@yahoo.com

Inscríbete en el Foro del blog y participa : A Vuelo De Un Quinde - El Foro!

miércoles, 26 de febrero de 2014

NASA : Ice on the Great Lakes in False Color Infrared


Ice on the Great Lakes in False Color Infrared
On Feb. 19, 2014 the Moderate Resolution Imaging Spectroradiometer (MODIS) aboard NASA’s Aqua satellite flew over the Great Lakes and captured this striking false-colored image of the heavily frozen Great Lakes – one of the hardest freeze-ups in four decades.
According to the National Oceanic and Atmospheric Administration (NOAA) Great Lakes Environmental Research Laboratory (GLERL), ice cover on North America’s Great Lakes peaked at 88.42% on Feb. 12-13 – a percentage not recorded since 1994. The ice extent has surpassed 80% just five times in four decades. The average maximum ice extent since 1973 is just over 50%.
Unusually cold temperatures in the first two months of the year, especially in January, are responsible for the high ice coverage. Very cold air blowing over the surface of the water removes heat from the water at the surface. When the surface temperature drops to freezing, a thin layer of surface ice begins to form. Once ice formation begins, persistently cold temperatures, with or without wind, is the major factor in thickening ice.
This false-color image uses a combination of shortwave infrared, near infrared and red (MODIS bands 7,2,1) to help distinguish ice from snow, water and clouds. Open, unfrozen water appears inky blue-black. Ice is pale blue, with thicker ice appearing brighter and thin, melting ice appearing a darker true-blue. Snow appears blue-green. Clouds are white to blue-green, with the colder or icy clouds appearing blue-green to blue.
Image Credit: NASA/Jeff Schmaltz, MODIS Land Rapid Response Team, NASA GSFC
NASA
Guillermo Gonzalo Sánchez Achutegui
Inscríbete en el Foro del blog y participa : A Vuelo De Un Quinde - El Foro!

Mi lista de blogs