Hola amigos: A VUELO DE UN QUINDE EL BLOG., La formación de un patrón distinto de las temperaturas superficiales del mar en el medio del Océano Pacífico Norte puede predecir un mayor riesgo de olas de calor del verano en la mitad oriental de los EE.UU. hasta 50 días de antelación.
El patrón es un contraste de más cálido que el promedio de agua procedentes de mares fríos en contra de lo normal. Cuando aparece, las probabilidades de que el calor extremo se huelga durante una semana en particular - o incluso en un día en particular - puede más que el triple, dependiendo de lo bien formado es el patrón.
Los hallazgos fueron publicados en la revista Nature Geoscience. El autor principal es el científico Karen McKinnon, del Centro Nacional de Investigación Atmosférica (NCAR) en Boulder, Colorado.
"Olas de calor del verano se encuentran entre los fenómenos meteorológicos más mortales, y pueden tener grandes efectos sobre la agricultura, el uso de energía y otros aspectos críticos de la sociedad", dijo McKinnon. "Si podemos dar a los planificadores urbanos y los agricultores un mano a mano que el calor extremo se encuentra en el camino, que podría ser capaz de evitar algunas de las peores consecuencias."
More information.........
Pacific pattern forms in advance of hot days in eastern U.S. Credit and Larger Version |
This is part 14 in a series on NSF's geosciences risk and resilience interest area. Please see parts one, two, three, four, five, six, seven, eight, nine, 10, 11, 12, 13 and 15.
The formation of a distinct pattern of sea surface temperatures in the middle of the North Pacific Ocean can predict an increased chance of summer heat waves in the eastern half of the U.S. up to 50 days in advance.
The pattern is a contrast of warmer-than-average water coming up against cooler-than-average seas. When it appears, the odds that extreme heat will strike during a particular week -- or even on a particular day -- can more than triple, depending on how well-formed the pattern is.
The findings were published today in the journal Nature Geoscience. The lead author is scientist Karen McKinnon of the National Center for Atmospheric Research (NCAR) in Boulder, Colorado.
"Summertime heat waves are among the deadliest weather events, and can have big effects on farming, energy use and other critical aspects of society," said McKinnon. "If we can give city planners and farmers a heads-up that extreme heat is on the way, we might be able to avoid some of the worst consequences."
In addition to McKinnon, the research team includes Andrew Rhines of the University of Washington, Martin Tingley of Pennsylvania State University and Peter Huybers of Harvard University.
"This intriguing result has enormous practical implications," said Candace Major, program director in the National Science Foundation (NSF) Division of Ocean Sciences, which funded the research along with NSF's Division of Atmospheric and Geospace Sciences. "The potential for predicting the risk of dangerous heat waves more than a month in advance is very exciting. With more time to prepare, communities have a greater chance of avoiding the serious economic and health consequences of weather extremes."
A fingerprint on the ocean
For the study, the scientists divided the country into regions that tend to experience extreme heat at the same time. They then focused on the largest of the resulting blocks: a swath that stretches across much of the Midwest and up the East Coast, encompassing important agricultural areas and heavily populated cities.
The researchers looked for a relationship between global sea surface temperature anomalies -- waters warmer or cooler than average -- and extreme heat in the eastern half of the U.S.
A pattern popped out in the middle of the Pacific, above a point roughly 20 degrees north latitude. The scientists could find the particular configuration of ocean water temperatures, which they named the Pacific Extreme Pattern, not only when the eastern U.S. was already hot, but also in advance of that heat.
"Whatever mechanisms ultimately lead to the heat wave also leave a fingerprint of sea surface temperature anomalies behind," McKinnon said.
Improving seasonal forecasts
To test how well that activity could predict future heat, the scientists used data collected from 1,613 weather stations across the eastern U.S. between 1982 and 2015, as well as daily sea surface temperatures from the same time period.
The researchers defined extreme heat in the eastern U.S. as a summer day when the temperature readings from the warmest 5 percent of weather stations in the region were at least 6.5 degrees Celsius (11.7 degrees Fahrenheit) hotter than average. They only examined extreme heat during that region's 60 hottest days of the year: June 24 through Aug. 22.
The scientists "hindcasted" each year in the data set to see if they could retrospectively predict extreme heat events -- or the lack of those events -- during that year's summer.
At 50 days out, they were able to predict an increase in the odds -- from about one-in-six to about one-in-four -- that a heat wave would strike somewhere in the eastern U.S. during a given week.
For a particularly well-formed pattern, at 30 days out or closer the scientists were able to predict that a heat wave would strike on a particular day at odds of better than one-in-two.
This new technique could improve existing seasonal forecasts, which do not focus on predicting daily extremes. Seasonal forecasts typically predict whether an entire summer is expected to be warmer than normal, normal, or cooler than normal.
For example, the seasonal forecast issued for the summer of 2012 predicted normal heat for the Northeast and Midwest. But the summer ended up being especially hot, thanks to three major heat waves that struck in late June, mid-July and late July.
When the research team used the Pacific Extreme Pattern to hindcast 2012, they were able to determine as early as mid-May increased odds of extremely hot days occurring in late June.
The hottest day of the summer of 2012, as measured by the technique used for this study, was June 29, when the warmest 5 percent of weather stations recorded temperatures that were 10.4 degrees Celsius (18.7 degrees Fahrenheit) above average.
"We found that we could go back as far as seven weeks and still predict an increase in the odds of future heat waves," McKinnon said. "What's exciting about this is the potential for long-range predictions of individual heat waves that give society far more notice than current forecasts."
Looking ahead
Scientists don't yet know why the fingerprint of sea surface temperatures in the Pacific predicts heat on the East Coast.
It could be that the sea surface temperatures themselves kick off weather patterns that cause the heat. Or it could be that they are both different results of the same phenomenon, but one does not cause the other.
To learn more about how the two are connected, McKinnon is working with colleagues at NCAR to use sophisticated computer models to try to tease apart what's happening.
The study's findings also point to the possibility that the Pacific Extreme Pattern, or a different oceanic fingerprint, could be used to forecast other weather events far in advance, including cooler-than-average days and extreme rainfall events.
"The results suggest that the state of the mid-latitude ocean may be a previously overlooked source of predictability for summer weather," McKinnon said.
-NSF-
cdybas@nsf.gov
David Hosansky, NCAR, (303) 497-8611,
hosansky@ucar.edu
The National Science Foundation (NSF) is an independent federal agency that supports fundamental research and education across all fields of science and engineering. In fiscal year (FY) 2016, its budget is $7.5 billion. NSF funds reach all 50 states through grants to nearly 2,000 colleges, universities and other institutions. Each year, NSF receives more than 48,000 competitive proposals for funding and makes about 12,000 new funding awards. NSF also awards about $626 million in professional and service contracts yearly.
Useful NSF Web Sites:
NSF Home Page:
http://www.nsf.gov
NSF News:
http://www.nsf.gov/news/
For the News Media:
http://www.nsf.gov/news/newsroom.jsp
Science and Engineering Statistics:
http://www.nsf.gov/statistics/
Awards Searches:
http://www.nsf.gov/awardsearch/
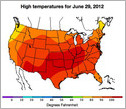
June 29, 2012, was the hottest day of the year in the eastern U.S.
Credit and Larger Version
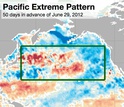
Sea surface temperature anomalies in the mid-latitude Pacific 50 days out from June 29, 2012.
Credit and Larger Version

The summer of 2012 was a scorcher. Three heat waves struck the U.S.
Credit and Larger Version
Heat waves affect energy use, farming and other aspects of society.
Credit and Larger Version

Grasses become sere and brown in the baking summer sun.
Credit and Larger Version
The National Science Foundation (NSF)
Guillermo Gonzalo Sánchez Achutegui
ayabaca@gmail.com
ayabaca@hotmail.com
ayabaca@yahoo.com
Inscríbete en el Foro del blog y participa : A Vuelo De Un Quinde - El Foro!

No hay comentarios:
Publicar un comentario