http://www.esa.int/spaceinimages/Images/2016/08/Planck_s_flame-filled_view_of_the_Polaris_Flare
Llamaradas en la Estrella Polar
22 agosto 2016
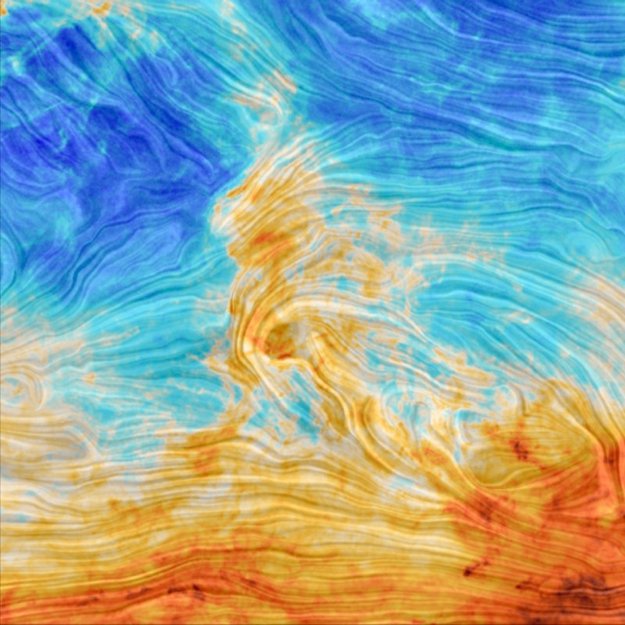
Esta imagen del satélite Planck de la ESA parece fruto de la imaginación: una figura emerge de las llamas a modo de espectro rojo y se desplaza hacia la izquierda de la fotografía en un remolino de cálidos colores.
Esta potente ilusión es, en realidad, la nube molecular conocida como “Polaris Flare”. Esta formación, de unos 10 años luz de diámetro, está compuesta por una maraña de filamentos de polvo alrededor de Polaris, en la constelación de la Osa Menor, a unos 500 años luz de distancia.
La nube se encuentra cerca del Polo Norte Celeste, un punto en el firmamento alineado con el eje de rotación de la Tierra. Esta línea imaginaria, que atraviesa los hemisferios norte y sur, apunta a los dos polos celestes. Para encontrar el Polo Celeste Norte, el observador solo tiene que localizar la Estrella Polar, o Polaris, que es la estrella más brillante de la constelación de la Osa Menor.
Algunos de los secretos de “Polaris Flare” fueron desvelados hace algunos años por el observatorio Herschel de la ESA. Gracias a una combinación de las observaciones de Herschel y a una simulación por ordenador, los científicos han llegado a la conclusión de que los filamentos de la red de Polaris podrían haberse formado mediante ondas de choque atravesando lentamente una densa nube interestelar, es decir, una acumulación de gas y polvo cósmico frío situada entre las estrellas de nuestra Galaxia.
Estas ondas de choque, similares a los estampidos sónicos en la Tierra, habrían sido generadas por la explosión de estrellas cercanas que, con su muerte, perturbaron el espacio a su alrededor, provocando una serie de turbulencias. Estas ondas hicieron que el gas y el polvo se elevase a su paso, formando los serpenteantes filamentos que se aprecian en la imagen.
Esta imagen no es una vista a color real ni una reproducción simulada de la red de filamentos, sino que comprende observaciones realizadas por el satélite Planck entre 2009 y 2013. Planck peinó y cartografió la totalidad del firmamento, incluyendo el plano de la Vía Láctea, en busca de signos de luz antigua (lo que se conoce como la radiación cósmica de fondo) y emisiones de polvo cósmico. Y fue precisamente una emisión de polvo lo que permitió a Planck crear este mapa único del firmamento: un mapa magnético.
Las líneas en relieve muestran la dirección aproximada del campo magnético de nuestra galaxia en la región de Polaris. La imagen fue creada utilizando la emisión observada de polvo cósmico polarizado (forzado en una dirección determinada). Los granos de polvo en la Vía Láctea y sus alrededores se ven afectados por el campo magnético de la Galaxia, entrelazándose con él y alineándose preferencialmente en el espacio. Este efecto se ha trasladado a la emisión de polvo, que también muestra una orientación preferencial, orientación detectada aquí por Planck.
Las emisiones de polvo cósmico se calculan a partir de una serie de observaciones realizadas por Planck a 353, 545 y 857 GHz, mientras que la dirección del campo magnético se deriva de los datos de polarización tomados por Planck a 353 GHz. Esta fotografía abarca un área de 30 x 30º en el firmamento y los colores representan la intensidad de la emisión de polvo.
Planck’s flame-filled view of the Polaris Flare

Details
- Title Planck’s flame-filled view of the Polaris Flare
- Released 22/08/2016 11:52 am
- Copyright ESA and the Planck Collaboration
- DescriptionThis image from ESA’s Planck satellite appears to show something quite ethereal and fantastical: a sprite-like figure emerging from scorching flames and walking towards the left of the frame, its silhouette a blaze of warm-hued colours.This fiery illusion is actually a celestial feature named the Polaris Flare. This name is somewhat misleading; despite its moniker, the Polaris Flare is not a flare but a 10 light-year-wide bundle of dusty filaments in the constellation of Ursa Minor (The Little Bear), some 500 light-years away.The Polaris Flare is located near the North Celestial Pole, a perceived point in the sky aligned with Earth’s spin axis. Extended into the skies of the northern and southern hemispheres, this imaginary line points to the two celestial poles. To find the North Celestial Pole, an observer need only locate the nearby Polaris (otherwise known as the North Star or Pole Star), the brightest star in the constellation of Ursa Minor.Some of the secrets of the Polaris Flare were uncovered when it was observed by ESA’s Herschel some years ago. Using a combination of such Herschel observations and a computer simulation, scientists think that the Polaris Flare filaments could have been formed as a result of slow shockwaves pushing their way through a dense interstellar cloud, an accumulation of cold cosmic dust and gas sitting between the stars of our Galaxy.These shockwaves, reminiscent of the sonic booms formed by fast sound waves here on Earth, would have been themselves triggered by nearby exploding stars that disrupted their surroundings as they died, triggering cloud-wide waves of turbulenceThese shockwaves, reminiscent of the sonic booms formed by fast sound waves here on Earth, were themselves triggered by nearby exploding stars that disrupted their surroundings as they died, triggering cloud-wide waves of turbulence. These waves swept up the gas and dust in their path, sculpting the material into the snaking filaments we see.This image is not a true-colour view, nor is it an artistic impression of the Flare, rather it comprises observations from Planck, which operated between 2009 and 2013. Planck scanned and mapped the entire sky, including the plane of the Milky Way, looking for signs of ancient light (known as the cosmic microwave background) and cosmic dust emission. This dust emission allowed Planck to create this unique map of the sky – a magnetic map.The relief lines laced across this image show the average direction of our Galaxy’s magnetic field in the region containing the Polaris Flare. This was created using the observed emission from cosmic dust, which was polarised (constrained to one direction). Dust grains in and around the Milky Way are affected by and interlaced with the Galaxy’s magnetic field, causing them to align preferentially in space. This carries through to the dust’s emission, which also displays a preferential orientation that Planck could detect.The emission from dust is computed from a combination of Planck observations at 353, 545 and 857 GHz, whereas the direction of the magnetic field is based on Planck polarisation data at 353 GHz. This frame has an area of 30 x 30º on the sky, and the colours represent the intensity of dust emission.
- Id 364216
TAGS
- Click on the tags to find the matching images.
- Activity Space Science
- Mission Planck
- Set Space Science image of the week
Guillermo Gonzalo Sánchez Achutegui
ayabaca@gmail.com
ayabaca@hotmail.com
ayabaca@yahoo.com
Inscríbete en el Foro del blog y participa : A Vuelo De Un Quinde - El Foro!

No hay comentarios:
Publicar un comentario