Mostrando entradas con la etiqueta Moderate Resolution Imaging Spectroradiometer (MODIS). Mostrar todas las entradas

domingo, 20 de septiembre de 2015

NASA : Satellite Image Shows 2015 Study of Amazon Wildfires is Correct .- Una imagen del satélite Terra, muestra que en 2015 los incendios forestales en el Río Amazonas son correctas.....

Hola amigos: A VUELO DE UN QUINDE EL BLOG., Los investigadores y los científicos de la NASA y la Universidad de California-Irvine informó este año que el riesgo de incendios forestales de la cuenca occidental del Amazonas debe ser menor este año que en el pasado de años; sin embargo ,la proyección de fuego para la parte oriental será mayor.
 Esta imagen de color natural recogidos por el satélite Terra con el Moderate Resolution Imaging Spectroradiometer, MODIS, instrumento el 10 de septiembre de 2015, parece demostrar que el modelo era correcto.
En el área de Amazonas, la actividad del fuego es baja, pero en Acre, Mato Grosso, Pará, y Rodonia, la actividad del fuego visto es mucho mayor. El estudio continúa diciendo la razón tiene que ver con el fenómeno de El Niño que se desarrolló a principios de este año y en la actualidad en pleno efecto. Según el estudio, "las temperaturas superficiales del mar en el Océano Pacífico son más cálidas que lo normal - condiciones de El Niño -. Que suprimen las lluvias en la Amazonia oriental.
 Las tres regiones con mayor riesgo son Brasil afirma Maranhão, Mato Grosso y Pará Mientras tanto, la superficie del mar. Las temperaturas en el Atlántico Norte tropical son promedio o más frío de lo normal, manteniendo una mayor cantidad de precipitaciones en el sur y el suroeste del Amazonas ".

More information..................
http://www.nasa.gov/image-feature/goddard/wildfires-in-amazonian-region-of-brazil

Fires in Brazil
Researchers and scientists at NASA and UC-Irvine reported this year that the wildfire risk for the western Amazon Basin should be lower this year than in year's past, however the fire projection for the eastern part will be higher.  This natural-color image collected by the Terra satellite with the Moderate Resolution Imaging Spectroradiometer, MODIS, instrument on September 10, 2015, seems to prove that model was correct.  In the area of Amazonas, fire activity is low, but in Acre, Mato Grosso, Para, and Rodonia, the fire activity seen is much higher.  The study goes on to say the reason has to do with the El Niño event which developed earlier this year and in currently in full effect.  According to the study, "Sea surface temperatures in the Pacific Ocean are warmer than normal – El Niño conditions – which suppress rainfall in the eastern Amazon. The three regions at highest risk are Brazil states Maranhão, Mato Grosso and Pará. Meanwhile, sea surface temperatures in the tropical North Atlantic are average or cooler than average, keeping higher amounts of rainfall in the south and southwestern Amazon."
To read the full study:
Actively burning areas, detected by MODIS’s thermal bands, are outlined in red. NASA image courtesy Jeff Schmaltz LANCE/EOSDIS MODIS Rapid Response Team, GSFC. Caption by Lynn Jenner
Last Updated: Sep. 11, 2015
Editor: Lynn Jenner
NASA
Guillermo Gonzalo Sánchez Achutegui
Inscríbete en el Foro del blog y participa : A Vuelo De Un Quinde - El Foro!

domingo, 23 de marzo de 2014

NASA : Coastal Flooding in New Zealand, Early March


Coastal Flooding in New Zealand, Early March
A powerful storm passed over New Zealand’s South Island in March 2014 and brought gale-force winds, torrential rains, and flooding to the city of Christchurch. A total of 74 millimeters (3 inches) of rain fell on March 4-5, according to MetService, New Zealand’s national meteorological service. More than 100 homes flooded and more than 4,000 lost power around the country’s third most populous city. Skies had cleared enough by March 6, 2014, for the Moderate Resolution Imaging Spectroradiometer (MODIS) on NASA’s Aqua satellite to acquire this image showing the aftermath.
Coastal communities are becoming increasingly vulnerable to the risk of damage and danger from flooding. NASA and NOAA are together launching a new opportunity for citizens to work with us on the very important topic of coastal flooding. This coastal flooding challenge is part of NASA’s third International Space Apps Challenge - a two-day global mass collaboration event on April 12-13, 2014. During these two days, citizens around the world are invited to engage directly with NASA to develop awe-inspiring software, hardware, and data visualizations. Last year’s event involved more than 9,000 global participants in 83 locations. This year will introduce more than 60 robust challenges clustered in five themes: asteroids, Earth watch, human spaceflight, robotics, and space technology. The Coastal Inundation In Your Community challenge is one of four climate-related challenges using data provided by NASA, NOAA and EPA.
Image Credit: NASA - Jeff Schmaltz, LANCE/EOSDIS MODIS Rapid Response Team at NASA GSFC
NASA
Guillermo Gonzalo Sánchez Achutegui
ayabaca@gmail.com
ayabaca@hotmail.com
ayabaca@yahoo.com
Inscríbete en el Foro del blog y participa : A Vuelo De Un Quinde - El Foro!

viernes, 15 de noviembre de 2013

NASA : Pine Island Glacier 2013: Nov. 10


Pine Island Glacier
This MODIS image taken by NASA’s Aqua satellite on Nov. 10, 2013, shows an iceberg that was part of the Pine Island Glacier and is now separating from the Antarctica continent. What appears to be a connection point on the top left portion of the iceberg is actually ice debris floating in the water.
The original rift that formed the iceberg was first observed in October 2011 but as the disconnection was not complete, the “birth” of the iceberg had not yet happened. It is believed the physical separation took place on or about July 10, 2013, however the iceberg persisted in the region, adjacent to the front of the glacier.
The iceberg is estimated to be 21 miles by 12 miles (35 km by 20 km) in size, roughly the size of Singapore. A team of scientists from Sheffield and Southampton universities will track it and try to predict its path using satellite data.
Image credit: NASA
NASA
Guillermo Gonzalo Sánchez Achutegui
ayabaca@gmail.com
ayabaca@hotmail.com
ayabaca@yahoo.com
Inscríbete en el Foro del blog y participa : A Vuelo De Un Quinde - El Foro!

martes, 16 de julio de 2013

NASA - Phytoplankton Bloom in the Norwegian Sea


Phytoplankton Bloom in the Norwegian Sea
The waters off Iceland rank among the world’s most productive fisheries. The reason for the abundance is an ample supply of phytoplankton, the base of the marine food chain. Like any plant, microscopic phytoplankton need sunlight and nutrients to survive. Iceland’s coastal waters offer both during the long days of summer.
The Moderate Resolution Imaging Spectroradiometer (MODIS) flying aboard NASA’s Aqua satellite acquired this true-color image of a large phytoplankton bloom in the Norwegian Sea, off of Iceland, on July 6, 2013. The range of colors from milky blue to green suggests that a range of different species make up this bloom, most likely including diatoms and perhaps chalky white coccolithophores, says Sergion Signorini, and ocean scientist at NASA Goddard Space Flight Center.
Floating in the water, phytoplankton act like tracers, revealing the course of mixing currents and the swirling eddies where they clash. A branch of the North Atlantic Current (the Gulf Stream) flows north, bringing warm Atlantic water to mix with the cold Arctic currents circling in from the east.
Image Credit: NASA/Jeff Schmaltz
NASA
Guillermo Gonzalo Sánchez Achutegui
ayabaca@gmail.com
ayabaca@hotmail.com
ayabaca@yahoo.com
Inscríbete en el Foro del blog y participa : A Vuelo De Un Quinde - El Foro!

jueves, 20 de junio de 2013

NASA - Rare Clear View of Alaska


 Download Image
NASA
Guillermo Gonzalo Sánchez Achutegui
ayabaca@gmail.com
ayabaca@hotmail.com
ayabaca@yahoo.com
Inscríbete en el Foro del blog y participa : A Vuelo De Un Quinde - El Foro!

lunes, 17 de junio de 2013

NASA - HS3 Mission to Delve into Saharan Dust

NASA's 2013 HS3 Hurricane Mission to Delve into Saharan Dust
A well-defined plume of dust swept across the entire Atlantic Ocean on June 24, 2009.
A well-defined plume of dust swept across the entire Atlantic Ocean on June 24, 2009. In this photo-like image taken by the Moderate Resolution Imaging Spectroradiometer (MODIS) on NASA’s Aqua satellite in three consecutive overpasses, the dust stretches from its origins in Africa’s Sahara Desert to the Lesser Antilles Islands on the eastern edge of the Caribbean Sea. Such spectacular dust storms are not uncommon. 
 Credit: NASA image by Jeff Schmaltz, MODIS Rapid Response. Caption by Michon Scott and Holli Riebeek with information provided by William Lau, NASA Goddard Space Flight Center. 

NASA's 2013 Hurricane and Severe Storms Sentinel or HS3 mission will investigate whether Saharan dust and its associated warm and dry air, known as the Saharan Air Layer or SAL, favors or suppresses the development of tropical cyclones in the Atlantic Ocean. The effects of Saharan dust on tropical cyclones is a controversial area of science. During the 2012 campaign, NASA's Global Hawk unmanned aircraft gathered valuable data on the dust layer that swirled around Tropical Storm Nadine for several days.

The Saharan dust layer is composed of sand and other mineral particles that are swept up in air currents and whisked westward over the Atlantic Ocean. The extreme daytime heating of the Sahara creates instability in the lowest layer of the atmosphere, warming and drying the air near the surface and cooling and moistening the air near the top of the dust layer near 5 kilometers (16,500 feet). Once it exits the African coast, the dust-laden air moves over air that is cooler, and moister, and it's the temperature inversion of warm air over cold that prevents deep cloud development. This suppression of deep cloud formation along with the dry air within the dust layer is reasons why this Saharan air layer is sometimes thought to suppress tropical cyclone development. On the other hand, the southern boundary of this hot desert air essentially acts like a front whose attendant wind patterns are a major source of the African waves that are precursors to storm formation.

Visible continents and an infrared Atlantic map frame the path of Nadine, staggering like a drunken monkey, overlapping the disciplined flight paths of the global hawk drone 
 › View larger
NASA's Global Hawk flew five science missions into Tropical Storm/Hurricane Nadine, plus the transit flight circling around the east side of Hurricane Leslie. This is a composite of the ground tracks of the transit flight to NASA Wallops plus the five science flights. TD means Tropical Depression; TS means Tropical Storm. 
Credit: NASA Some Saharan dust has been known to make the journey across the Atlantic and to the U.S. east coast. But Saharan dust doesn't just cause sunrises to appear more reddish, the dust also impacts the development of clouds and precipitation. The dust particles can provide a surface for small cloud droplets and ice crystals to form within clouds. More dust particles means that a given amount of available water is spread onto more particles, creating large numbers of small drops and delaying the formation of larger raindrops. Those effects, coupled with the warm and dry air, have presented challenges to meteorologists who have been trying to understand the effect of Saharan dust on tropical cyclones.

HS3 addresses the controversial role of the Saharan Air Layer, or SAL, in tropical storm formation and intensification by taking measurements from three instruments on board the Global Hawk. These instruments include a cloud physics lidar which uses a laser to measure vertical profiles of dust; a dropsonde system that releases small instrumented packages from the aircraft that fall to the surface while measuring profiles of temperature, humidity, and winds; and an infrared sounder that measures temperature and humidity in clear-sky regions.

On Sept. 11 and 12, during the 2012 HS3 mission, the NASA Global Hawk aircraft covered more than one million square kilometers (386,100 square miles) going back and forth over the storm in a gridded fashion in what's called a "lawnmower pattern."

The SAL was present primarily during that first flight, and again on the flight from Sept. 14 to 15. "The SAL did not act to suppress development on Sept. 11 and 12, at least not in the sense of a direct intrusion into the storm circulation, but it is too early to say what role it might have played in other ways and in other flights," said Scott Braun, HS3 Principal Investigator, at NASA's Goddard Space Flight Center, Greenbelt, Md. "There is some evidence that it (the SAL) was getting into the storm circulation on Sept. 14 and 15, but the extent to which it impacted development is unclear."

The dust data collected by the Global Hawk is important for scientific studies on the SAL. Other data was useful operationally to the National Hurricane Center (NHC), the entity that issues forecasts for tropical cyclones. The forecasters at the NHC used data from dropsondes released from the Global Hawk in the discussion of Nadine at 11 a.m. EDT on Sept. 20, "The current intensity is kept at 45 knots (51.7 mph/83.3 kmh)…is in good agreement with dropsonde data from the NASA global hawk aircraft and AMSU [satellite instrument] estimates."

drone coming in for a landing
The Global Hawk unmanned aircraft coming in for a landing at NASA's Wallops Flight Facility in Wallops Island, Va on Sept. 7, 2012. Credit: NASA Wallops 

Valuable data from the Global Hawk dropsondes on September 22-23 provided the National Hurricane Center with information that contributed to their reclassifying the storm as a tropical storm after one day of being called a post-tropical low. Shortly after HS3’s last flight into Nadine on September 26-27, Nadine actually strengthened back into a hurricane and reached its maximum intensity.

Dropsonde data from HS3’s flight on September 26-27 showed that temperature and humidity conditions in the storm were becoming more favorable for the occurrence of deep thunderstorms. Infrared data from NASA's Aqua satellite on Sept. 28, 2012, revealed that strong convection and thunderstorms did build up again and strengthened Nadine back into a hurricane.

HS3 is a five-year mission specifically targeted to investigate the processes that underlie hurricane formation and intensity change in the Atlantic Ocean basin.

For NASA's storm history of Hurricane Nadine, visit:
http://www.nasa.gov/mission_pages/hurricanes/archives/2012/h2012_Nadine.html
For more information about easterly waves, visit:
http://www.aoml.noaa.gov/hrd/tcfaq/A4.html
 
 
Robert Gutro
NASA's Goddard Space Flight Center, Greenbelt, Md.
Guillermo Gonzalo Sánchez Achutegui
ayabaca@gmail.com
ayabaca@hotmail.com
ayabaca@yahoo.com
 Inscríbete en el Foro del blog y participa : A Vuelo De Un Quinde - El Foro!

domingo, 9 de junio de 2013

NASA - Andrea (Atlantic/Gulf of Mexico)

NASA Sees Tropical Storm Andrea Cover Half the East Coast

This NOAA GOES-East satellite animation shows the landfall and movement of Tropical Storm Andrea from June 5 to June 7. The video ends as Andrea's center was moving over South Carolina on its way up the eastern seaboard. Credit: NASA/NOAA GOES Project

As Tropical Storm Andrea continued pushing up the east coast of the United States on Friday, June 7, NOAA’s GOES-East satellite captured an image that showed its extensive cloud cover. By early afternoon on June 7, Andrea was centered over North Carolina, but its cloud cover blanketed half of the east coast.

TRMM image of Andrea 
› Larger image
The TRMM image showed most of the rain was well ahead of the center of circulation. A broad area of light (shown in blue) to moderate rain (shown in green) covers the eastern half of Georgia and all of South Carolina. A cluster of heavier rain cells (shown in red) is poised to move onshore along the upper part of the South Carolina coast while at the same time the area right around the storm's center is nearly devoid of rain. At the time of this image, Andrea had weakened slightly to a moderate tropical storm with sustained winds reported at 50 mph. Credit: SSAI/NASA

GOES image of Andrea 
› Larger image
NOAA’s GOES-14 satellite provided this visible image of Tropical Storm Andrea on Friday, June 7 at 2:31 p.m. EDT. The center of Andrea was near Fayetteville, North Carolina at the time, and the bulk of the clouds and rain stretched from northwest to northeast of the center. Andrea’s clouds extended over the Great Lakes and New England. Credit: NASA/NOAA GOES Project NOAA’s GOES-14 satellite captured a visible image of Andrea at 2:31 p.m. EDT. The center of Andrea was near Fayetteville, North Carolina at the time, and the bulk of the clouds and rain stretched from northwest to northeast of the center. Andrea’s clouds extended over the Great Lakes and New England.

NASA Sees Andrea’s Rainfall in 3-D

Earlier in the day at 02:35 UTC on June 7 (10:35 p.m. EDT, June 6), NASA’s Tropical Rainfall Measuring Mission or TRMM satellite, captured an image of Andrea as the center was moving through northeast Florida about five hours after it made landfall. The image showed the horizontal distribution of rain intensity within the storm.

The rainfall rate image was created at NASA’s Goddard Space Flight Center in Greenbelt, Md. by adding together data from two TRMM instruments. The rain rates in the center of the swath are from the TRMM Precipitation Radar (PR), and those in the outer swath are from the TRMM Microwave Imager (TMI). The rain rates are overlaid on infrared (IR) data from the TRMM Visible Infrared Scanner (VIRS).

The TRMM image showed most of the rain was well ahead of the center of circulation. A broad area of light to moderate rain covered the eastern half of Georgia and all of South Carolina. A cluster of heavier rain cells was poised to move onshore along the upper part of the South Carolina coast while at the same time the area right around the storm's center was nearly devoid of rain. At the time of the image, Andrea had weakened slightly to a moderate tropical storm with sustained winds reported at 50 mph.

Andrea’s Location

At 2 p.m. EDT on June 7, Andrea was losing its tropical characteristics, but some thunderstorms were still forming near the center. Andrea’s maximum sustained winds were near 45 mph (75 kph), and it was moving to the northeast at 28 mph (44 kph). Andrea’s minimum central pressure was near 996 millibars.

At that time, there was a tropical storm warning in effect from north of Little River Inlet to Cape Charles Light, Virginia and for the Pamlico and Ablemarle Sounds.

Coastal areas are dealing with the most threats and that will be the case as Andrea continues her northward track. For example, the following watches and hazards were in effect for coastal Maryland and Virginia for the lower Chesapeake Bay south of New Port Comfort: A Flood Watch until midnight, a Beach Hazards Statement, High Rip Current Risk and Tornado Watch until 8 p.m. EDT.


This flyby animation showed most of the rain was well ahead of the center of circulation. A broad area of light (shown in blue) to moderate rain (shown in green) covers the eastern half of Georgia and all of South Carolina. A cluster of heavier rain cells (shown in red) is poised to move onshore along the upper part of the South Carolina coast while at the same time the area right around the storm's center is nearly devoid of rain. At the time of this animation, Andrea had weakened slightly to a moderate tropical storm with sustained winds reported at 50 mph. Credit: SSAI/NASA, Hal Pierce

Rainfall continues to be a big threat from Andrea. The tropical storm is expected to produce total rain accumulations of 2 to 4 inches from central and eastern North Carolina northeastward along the eastern seaboard into coastal Maine. According to the National Hurricane Center, tropical storm conditions will continue to spread northeastward along the U.S. east coast strong winds are possible elsewhere along the coast from Virginia to Atlantic Canada through early Sunday, June 9. A few tornadoes are possible over eastern portions of North Carolina and Virginia today.

The National Hurricane Center expects Andrea to turn toward the east-northeast late on June 8.


Text credit: Rob Gutro, NASA's Goddard Space Flight Center, Greenbelt, Md., with data from the National Hurricane Center


NASA Provides 3 Satellite Views of Tropical Storm Andrea's Progression

NASA's Aqua and Terra satellites captured visible and infrared views of tropical storm Andrea as it continues to track north along the U.S. East Coast June 7. NOAA's GOES-East satellite provides continuous images and showed that, although Andrea's center was over South Carolina, its cloud cover extended from Florida to New England.

GOES image of Andrea
This image of tropical storm Andrea was assembled from data collected by NOAA's GOES-14 satellite at 8:31 a.m. EDT on June 7, when the storm's center was about 35 miles north-northwest of Charleston, S.C.
Credit: NASA/NOAA GOES Project
› Larger image

Just before 5 p.m. EDT, tropical storm Andrea made landfall near the Big Bend of Florida. At that time, Andrea was moving northeast at 17 mph, with maximum sustained winds near 65 mph. At 5 p.m. EDT, Andrea's center was near 29.5 degrees north latitude and 83.4 west longitude, about 35 miles (55 km) north-northwest of Cedar Key, Fla.

Terra image of Andrea This image from the MODIS instrument aboard NASA's Terra satellite shows tropical storm Andrea on June 6, 2013, at 2:45 p.m. EDT, as the system was making landfall in the big bend area of Florida. NASA's Terra satellite captured a visible image of tropical storm Andrea on June 6 at 2:45 p.m. EDT as it was making landfall in the Big Bend area of Florida. Another NASA satellite, Aqua, captured an infrared look at Andrea 10 minutes later. The Atmospheric Infrared Sounder instrument aboard Aqua captured infrared data that was made into a false-colored image at NASA's Jet Propulsion Laboratory in Pasadena, Calif. The Aqua image showed where the strongest thunderstorms were located, using cloud top temperature as a marker. The higher the thunderstorms, the colder the cloud tops, and the more likely they are generating heavy rainfall. At 5 a.m. EDT on June 7 Andrea was moving over the U.S. Southeast and rapidly losing tropical characteristics. Satellite data showed that most of the rain was displaced to the northwestern quadrant. Satellite data also showed that dry air moved in between the center and a band of thunderstorms east of the center. Dry air saps the strength out of thunderstorms. As of 8 a.m. EDT, a tropical storm warning was in effect from north of the Savannah River to Cape Charles Light, Va., the Pamlico and Albemarle sounds in North Carolina, and the lower Chesapeake Bay south of New Point Comfort, Va. Many local flash flood watches and tornado watches are currently in effect or will be in effect later in the day as Andrea moves north. At 8 a.m. EDT Andrea's maximum sustained winds were down to 45 mph (75 kph) and the strongest winds were east of the storm's center. Andrea was centered about 35 miles (60 km) north-northwest of Charleston, S.C., near 33.4 degrees north latitude and 80.2 degrees west longitude. Andrea was moving to the northeast at 28 mph (44 kph). Minimum central pressure was near 996 millibars. The National Oceanic and Atmospheric Administration's GOES-14 satellite captured a visible image of tropical storm Andrea at 8:31 a.m. EDT on June 7, when the storm's center was about 35 miles north-northwest of Charleston, S.C. Andrea's cloud cover extended from Florida to Maine on the satellite view. According to the National Hurricane Center, Andrea is expected to produce total rain accumulations of 2 to 4 inches from central and eastern North Carolina, northeastward along the eastern seaboard into coastal Maine. Additional rain totals of up to 2 inches are expected over portions of eastern Georgia and South Carolina through the morning of June 7, which could bring storm total amounts up to 6 inches across those areas. In addition to heavy rainfall and large rain fall totals, isolated tornadoes are also a possibility as with any land-falling tropical system. The National Hurricane Center noted that Andrea's storm surge, combined with tide will cause normally dry areas near the coast to be flooded by rising waters. NHC expects Andrea to become post-tropical later today. Rob Gutro, , Greenbelt, Md., with data from the National Hurricane Center Towering thunderstorms are a sign of a strong tropical cyclone, and NASA’s TRMM satellite spotted thunderstorms reaching heights of almost 9 miles high within Tropical Storm Andrea. NASA’s Aqua satellite provided an infrared view that revealed very cold cloud top temperatures that coincided with the towering thunderstorms that TRMM saw. The Atmospheric Infrared Sounder or AIRS instrument aboard NASA’s Aqua satellite captured an infrared image of the temperatures in Tropical Storm Andrea’s cloud tops on June 6 at 2:41 a.m. EDT. The coldest cloud top temperatures (in excess of -63F/-52C) and heaviest precipitation was over the eastern Gulf of Mexico and southeastern Florida at the time of the image. NASA’s Tropical Rainfall Measuring Mission or TRMM satellite flew directly above tropical storm Andrea on Thursday, June 6, 2013 at 0508 UTC (1:08 a.m. EDT). This orbit showed that Andrea had a large area of moderate to heavy rainfall in the northeast quadrant of the storm and precipitation was spreading over the state of Florida. At NASA’s Goddard Space Flight Center in Greenbelt, Md. Hal Pierce of the TRMM Science Team used TRMM data create a 3-D view of Tropical Storm Andrea. The 3-D view from the west was derived from TRMM Precipitation Radar (PR) data captured when Andrea was examined by the TRMM satellite with the June 5, 2234 UTC (6:34 p.m. EDT) orbit. It clearly showed that the majority of the heavy convective rainfall was located on Andrea's eastern side. TRMM PR also showed that the tallest convective thunderstorms reached heights of about 14km (~8.7 miles). On June 6, at 2 p.m. EDT, Tropical Storm Andrea was located near 29.0 north and 83.6 west. That's just 35 miles (55 km) west-southwest of Cedar Key, Fla. and 100 miles (160 km) east-southeast of Apalachicola. Andrea's maximum sustained winds were near 60 mph (95 kph) and had slightly increased forward speed, moving northeast at 17 mph (28 kph). Minimum central pressure is 994 millibars, down from 997 millibars during the morning hours. At 2 p.m. EDT, the National Hurricane Center noted that the center of Andrea will reach the coast of the big bend area of Florida in the next few hours. A Tropical Storm Warning is in effect for the west coast of Florida from Boca Grande to Indian Pass, from Flagler Beach, Fla. to Cape Charles Light, Va., the Pamlico and Albemarle Sounds, and the lower Chesapeake Bay south of New Point Comfort, Va. For the most up to date forecasts, visit the National Hurricane Center web page at: . Andrea is expected to move northeastward after crossing Florida and travel near the east coast of the United States through Saturday, June 8. NASA’s TRMM satellite passed over Tropical Storm Andrea right after it was named, while NASA’s Terra satellite captured a visible image of the storm’s reach hours beforehand. TRMM measures rainfall from space and saw that rainfall rates in the southern part of the storm was falling at almost 5 inches per hour. NASA’s Terra satellite passed over Tropical Storm Andrea on June 5 at 16:25 UTC (12:25 p.m. EDT) and the Moderate Resolution Imaging Spectroradiometer or MODIS instrument, captured a visible image of the storm. At that time, Andrea’s clouds had already extended over more than half of Florida. At 8 p.m. EDT on Wednesday, June 5, System 91L became the first tropical storm of the Atlantic Ocean hurricane season. Tropical Storm Andrea was centered near 25.5 North and 86.5 West, about 300 miles (485 km) southwest of Tampa, Fla. At the time Andrea intensified into a tropical storm, its maximum sustained winds were near 40 mph (65 kph). NASA's Tropical Rainfall Measuring Mission or TRMM satellite flew directly above tropical storm Andrea on June 5 at 2234 UTC (6:34 p.m. EDT) just an hour after the National Hurricane Center named the storm. A rainfall analysis from TRMM's Microwave Imager and Precipitation Radar (PR) instruments showed that moderate to heavy rain was wrapping around the eastern side of the storm. The heaviest rainfall of 124.5 mm per hour (~4.9 inches per hour) from TRMM PR data was found on Andrea's southeast side. NASA’s GOES Project at NASA’s Goddard Space Flight Center in Greenbelt, Md. created an animation that shows the development of System 91L into Tropical Storm Andrea, and its progression over June 4, 5 and 6, as it heads for a landfall in Florida. On June 6, at 8am EDT, Tropical Storm Andrea was located near 27.7 north and 85.1 west. That's about 160 miles (255 km) west of Tampa, Fla. and 140 miles (225 km) south of Apalachicola. Andrea's maximum sustained winds were near 60 mph (95 kph) and she was moving north-northeast at 14 mph (22 kph). Minimum central pressure is 997 millibars. A Tropical Storm Warning is in effect for the west coast of Florida from Boca Grande to Indian Pass, from Flagler Beach, Fla. to Cape Charles Light, Va., the Pamlico and Albemarle Sounds, and the lower Chesapeake Bay south of New Point Comfort, Va. For the most up to date forecasts, visit the National Hurricane Center web page at: . NASA’s Aqua satellite passed over low pressure System 91L in the Gulf of Mexico and captured infrared imagery that revealed a lot of uplift and strong thunderstorms in the eastern part of the storm despite a poorly organized circulation. NOAA's GOES-East satellite showed the large extent of the low pressure area stretching from Mexico's Yucatan Peninsula to Florida. System 91L is a tropical low pressure area that has been lingering in the northwestern Caribbean Sea and the Gulf of Mexico for several days. The low pressure area is located in the central Gulf of Mexico and covers a large area. It has a large area of disorganized thunderstorms and strong gusty winds over the southeastern Gulf. The National Hurricane Center (NHC) noted that thunderstorm activity increased on June 5, compared to June 4, but the center of circulation is poorly-defined. NASA’s Aqua satellite passed over System 91L on June 4 and June 5 and captured infrared images of the storm. The two infrared images of System 91L showed areas with the coldest cloud top temperatures and strongest thunderstorms moved to the north. Images were captured on June 4 at 18:47 UTC (2:47 p.m. EDT) and June 5 at 06:59 UTC (2:59 a.m. EDT). The coldest temperatures were near -63F/-52C and indicated areas of likely heavy rainfall. In the June 4 image, the strongest thunderstorms were between Mexico’s Yucatan Peninsula and western Cuba. On June 5, those strongest thunderstorms were over western Cuba and stretched north, over southwestern Florida. NOAA’s GOES-14 satellite captured a visible image of System 91L the on June 6 at 17:10 UTC (1:10 p.m. EDT). The image showed that System 91L’s cloud cover extended from Mexico’s Yucatan Peninsula east to Cuba and north over the state of Florida. Southern Florida, the Florida Keys and western Cuba can expect heavy rain, inland flooding and gusty winds over the next couple of days. Isolated tornadoes are also possible over the Florida peninsula late tonight, June 6, through Thursday. Currently on June 6, many areas of Florida are under watches and advisories. For example, in Tampa, the following are in effect from June 5 through June 8 at 8 p.m. EDT: a Coastal Flood Advisory; a High Surf Advisory; a Rip Current Statement; and a Flood Watch. Current rain totals expected by the National Weather Service are between 3 and 5 inches of rain today, June 6. The NHC gives System 91L a high chance (60%) of becoming a subtropical or tropical cyclone within the next 2 days. At the NHC 2 p.m. EDT update on June 6, forecasters noted there is potential for this system to become a Tropical depression or storm before it moves across northern Florida late Thursday or Thursday night. Even if System 91L does not become a tropical storm, the National Weather Service expects the low to soak the southeastern U.S. and Mid-Atlantic states over the next couple of days as it moves northward.

Credit: NASA Goddard's MODIS Rapid Response Team

› Larger image
AIRS infrared image of Andrea This infrared image of tropical storm Andrea was taken from the AIRS instrument aboard NASA's Aqua satellite on June 6 at 2:35 p.m. EDT. The areas with the coldest cloud top temperatures and strongest thunderstorms (purple) were near minus 63 F (minus 52 C) and indicated areas of likely heavy rainfall.
Credit: NASA JPL/Ed Olsen
› Larger image
Satellite Imagery Inside and Out

Text credit:NASA's Goddard Space Flight Center


June 06, 2013

Update #2

AIRS image of Andrea 
› Larger image
This infrared image of the temperatures of Tropical Storm Andrea’s cloud tops was taken by the AIRS instrument aboard NASA’s Aqua satellite on June 6 at 2:41 a.m. EDT. The dark purple indicates coldest cloud top temperatures (in excess of -63F/-52C) and heavy rainfall. At that time, most of the heaviest precipitation was over the eastern Gulf of Mexico and southeastern Florida. Credit: NASA JPL, Ed Olsen

TRMM image of Andrea 
› Larger image
On June 6, TRMM showed that Andrea had a large area of moderate to heavy rainfall in the northeast quadrant of the storm and precipitation was spreading over the state of Florida. The cloud cover extended over the northern half of Florida, but was out of range of TRMM’s orbit. Credit: SSAI/NASA, Hal PierceNASA Satellite Reveals Tropical Storm Andrea’s Towering Thunderstorms
www.nhc.noaa.gov


This 3-D view from the west was derived from TRMM Precipitation Radar (PR) data captured when Andrea was examined by the TRMM satellite with the June 5, 2234 UTC (6:34 p.m. EDT) orbit. It clearly shows that the majority of the heavy convective rainfall was located on Andrea's eastern side. TRMM PR also showed that the tallest convective thunderstorms reached heights of about 14km (~8.7 miles). Credit: SSAI/NASA, Hal Pierce Click here to DOWNLOAD: http://trmm.gsfc.nasa.gov/trmm_rain/Events/andrea_5june2013_2234_utc_trmm_flyby.mov


Text credit: Hal Pierce/Rob Gutro
SSAI/NASA’s Goddard Space Flight Center


TRMM image of Andrea 
› Larger image
NASA's TRMM satellite flew directly above tropical storm Andrea on June 5 at 2234 UTC (6:34 p.m. EDT) just an hour after the National Hurricane Center named the storm. The heaviest rainfall of 124.5 mm per hour (~4.9 inches per hour) was found on Andrea's southeast side. Credit: NASA/SSAI, Hal Pierce

GOES image of Andrea 
› Larger image
NASA’s Terra satellite passed over Tropical Storm Andrea on June 5 at 16:25 UTC (12:25 p.m. EDT) and the MODIS instrument captured this visible image of the storm. Andrea’s clouds had already extended over more than half of Florida. Credit: NASA Goddard MODIS Rapid Response Team NASA Sees Heavy Rainfall in Tropical Storm Andrea


This NOAA GOES-East satellite animation shows the development of System 91L into Tropical Storm Andrea over the course of 3 days from June 4 to June 6, just after Andrea was officially designated a tropical storm. Credit: NASA's GOES Project.

www.nhc.noaa.gov

Text credit: Rob Gutro
NASA’s Goddard Space Flight Center


June 05, 2013

GOES image of 91L 
› Larger image
This visible image of System 91L was taken from the GOES-14 satellite on June 6 at 17:10 UTC (1:10 p.m. EDT). System 91L’s cloud cover extends from Mexico’s Yucatan Peninsula east to Cuba and north over the state of Florida. Credit: NASA GOES Project

AIRS image of 91L 
› Larger image
These two infrared images of System 91L taken from the AIRS instrument aboard NASA’s Aqua satellite show the areas with the coldest cloud top temperatures and strongest thunderstorms (purple) on June 4 at 18:47 UTC and June 5 at 06:59 UTC. The coldest temperatures were -63F/-52C and also indicated areas of likely heavy rainfall. Credit: NASA JPL/Ed OlsenNASA Satellite Sees Strong Thunderstorms in Developing Gulf Low 
Text credit: Rob Gutro
NASA’s Goddard Space Flight Center
NASA
Guillermo Gonzalo Sánchez Achutegui
ayabaca@gmail.com
ayabaca@hotmail.com
ayabaca@yahoo.comInscríbete en el Foro del blog y participa : A Vuelo De Un Quinde - El Foro!

sábado, 5 de enero de 2013

NASA - Snow-Covered Desert


 Snow-covered deserts are rare, but that’s exactly what the Moderate Resolution Imaging Spectroradiometer (MODIS) on NASA’s Aqua satellite observed as it passed over the Taklimakan Desert in western China on Jan. 2, 2013.

Download Image

› Full Size 
NASA
Guillermo Gonzalo Sánchez Achutegui
ayabaca@gmail.com
ayabaca@hotmail.com
ayabaca@yahoo.com
 Inscríbete en el Foro del blog y participa : A Vuelo De Un Quinde - El Foro!

domingo, 22 de julio de 2012

The Earth: Ice Breaks off of Petermann Glacier

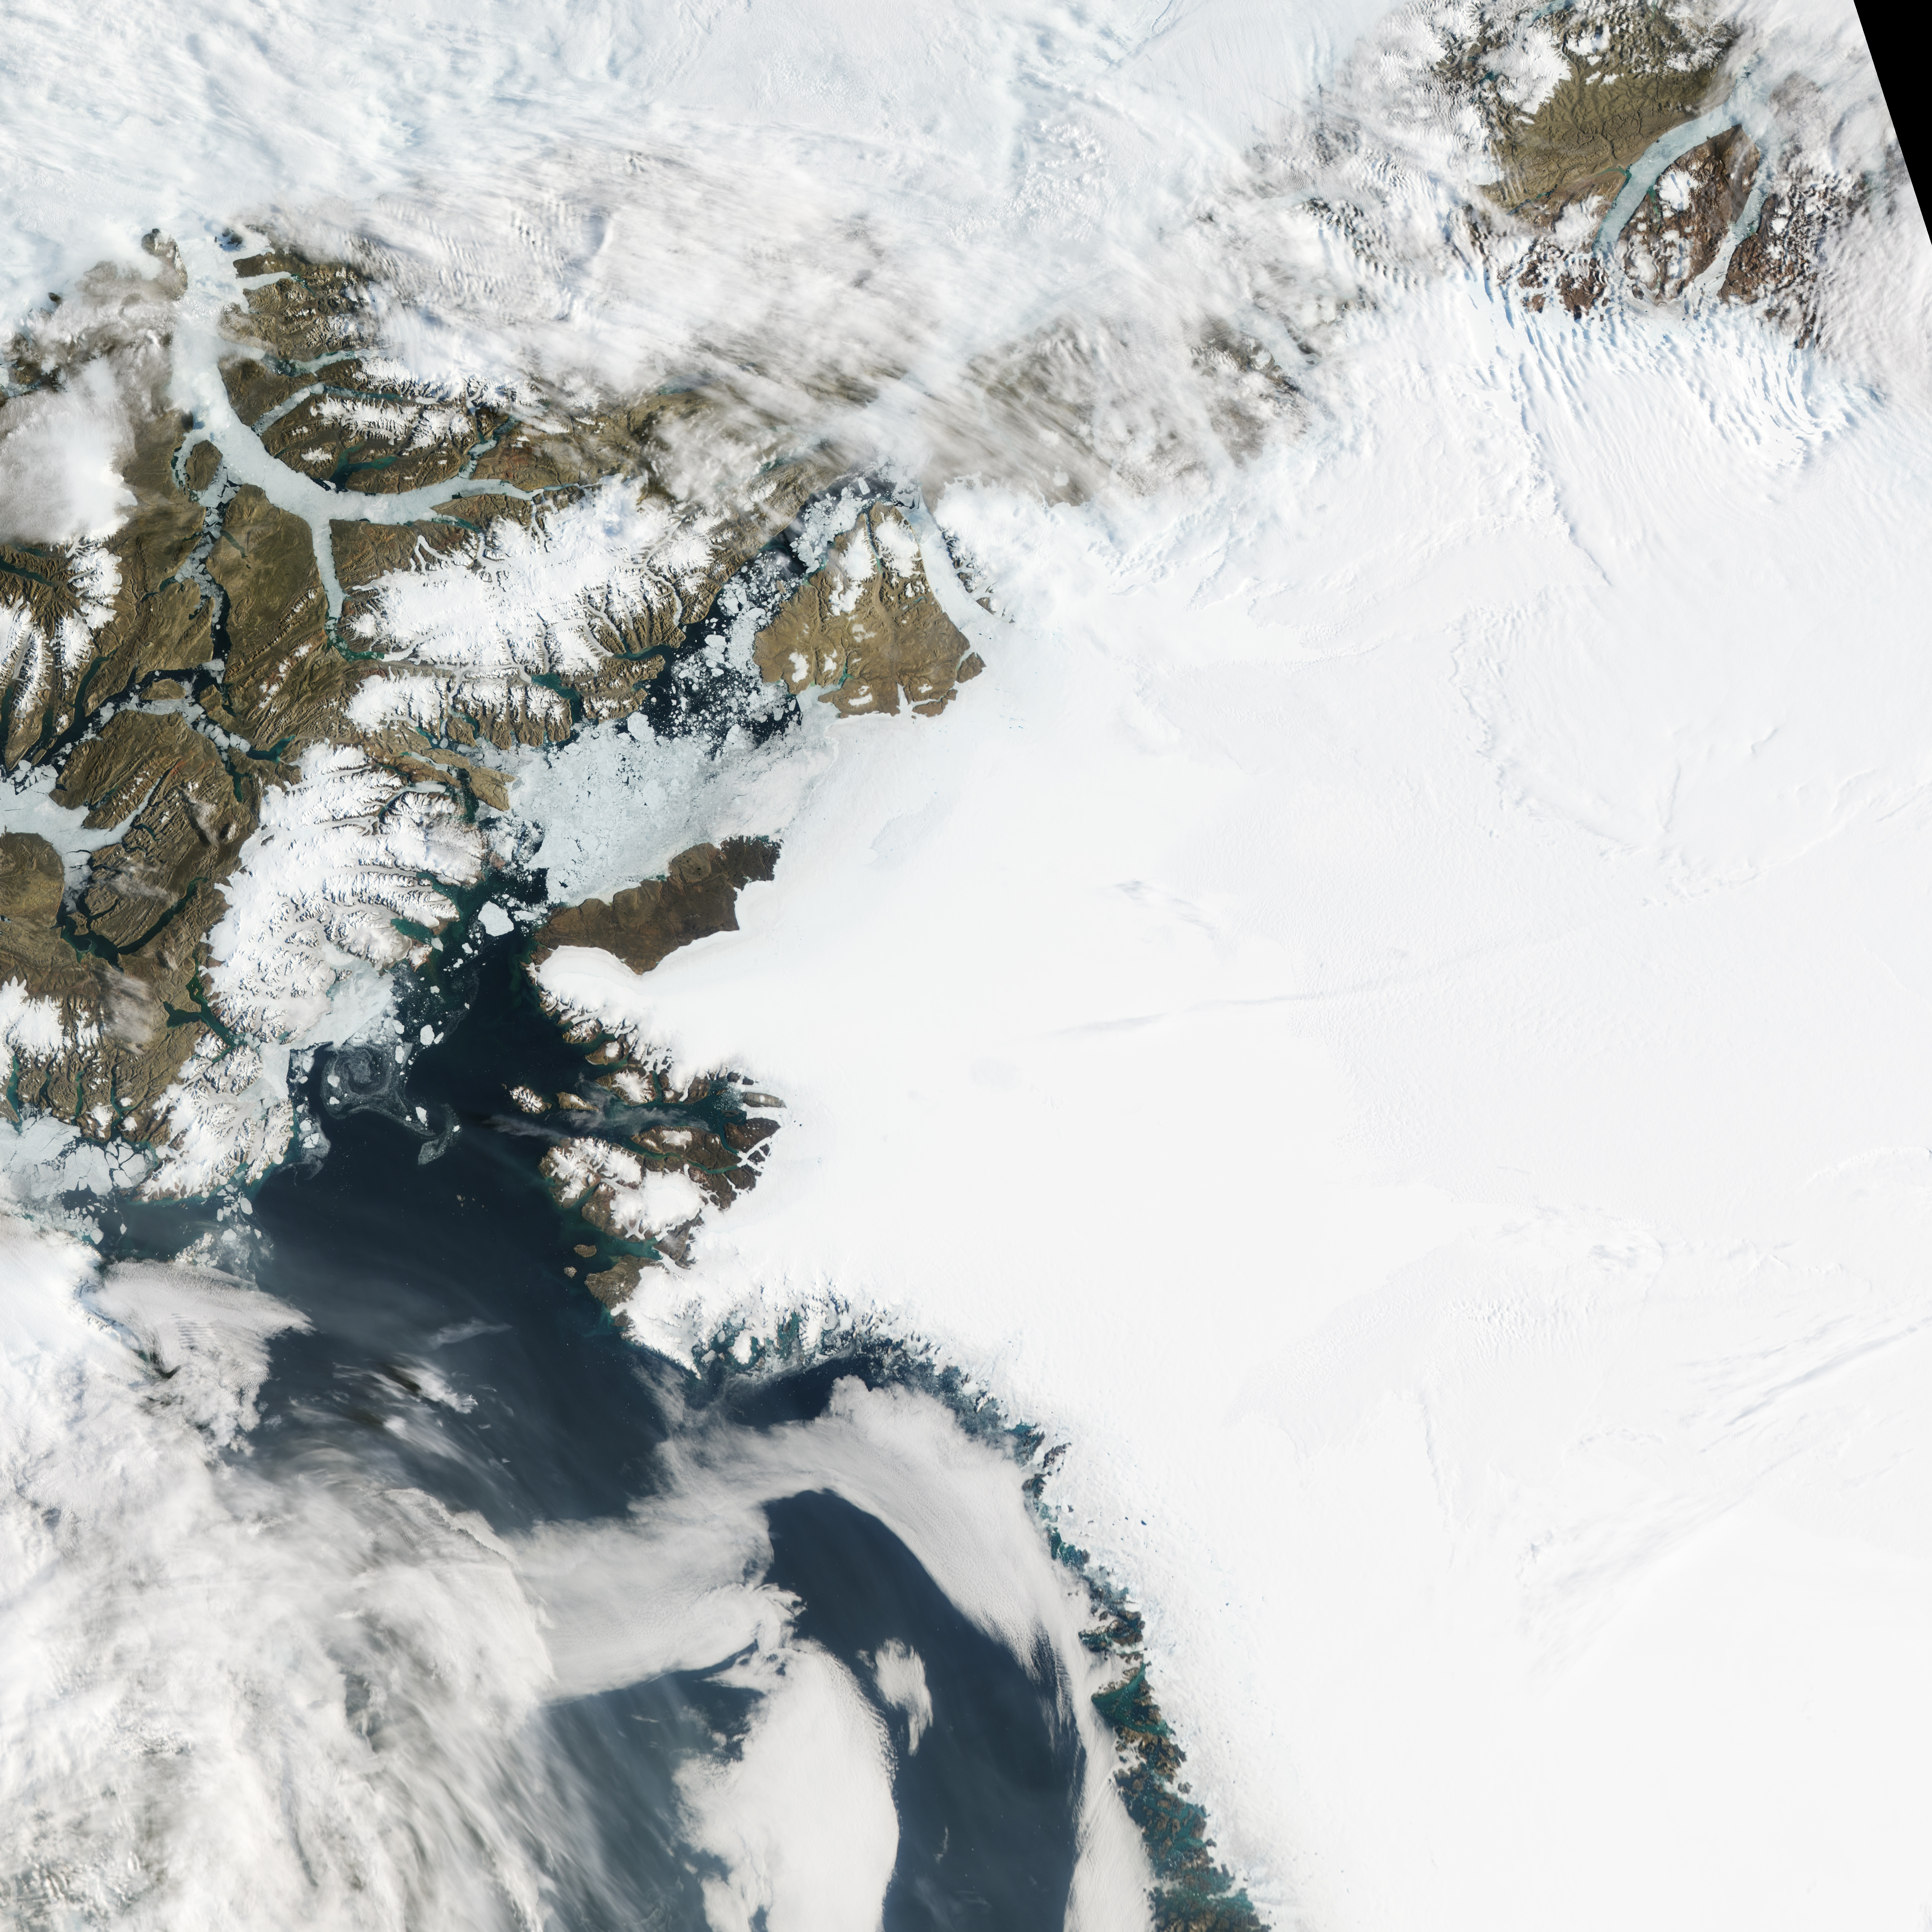
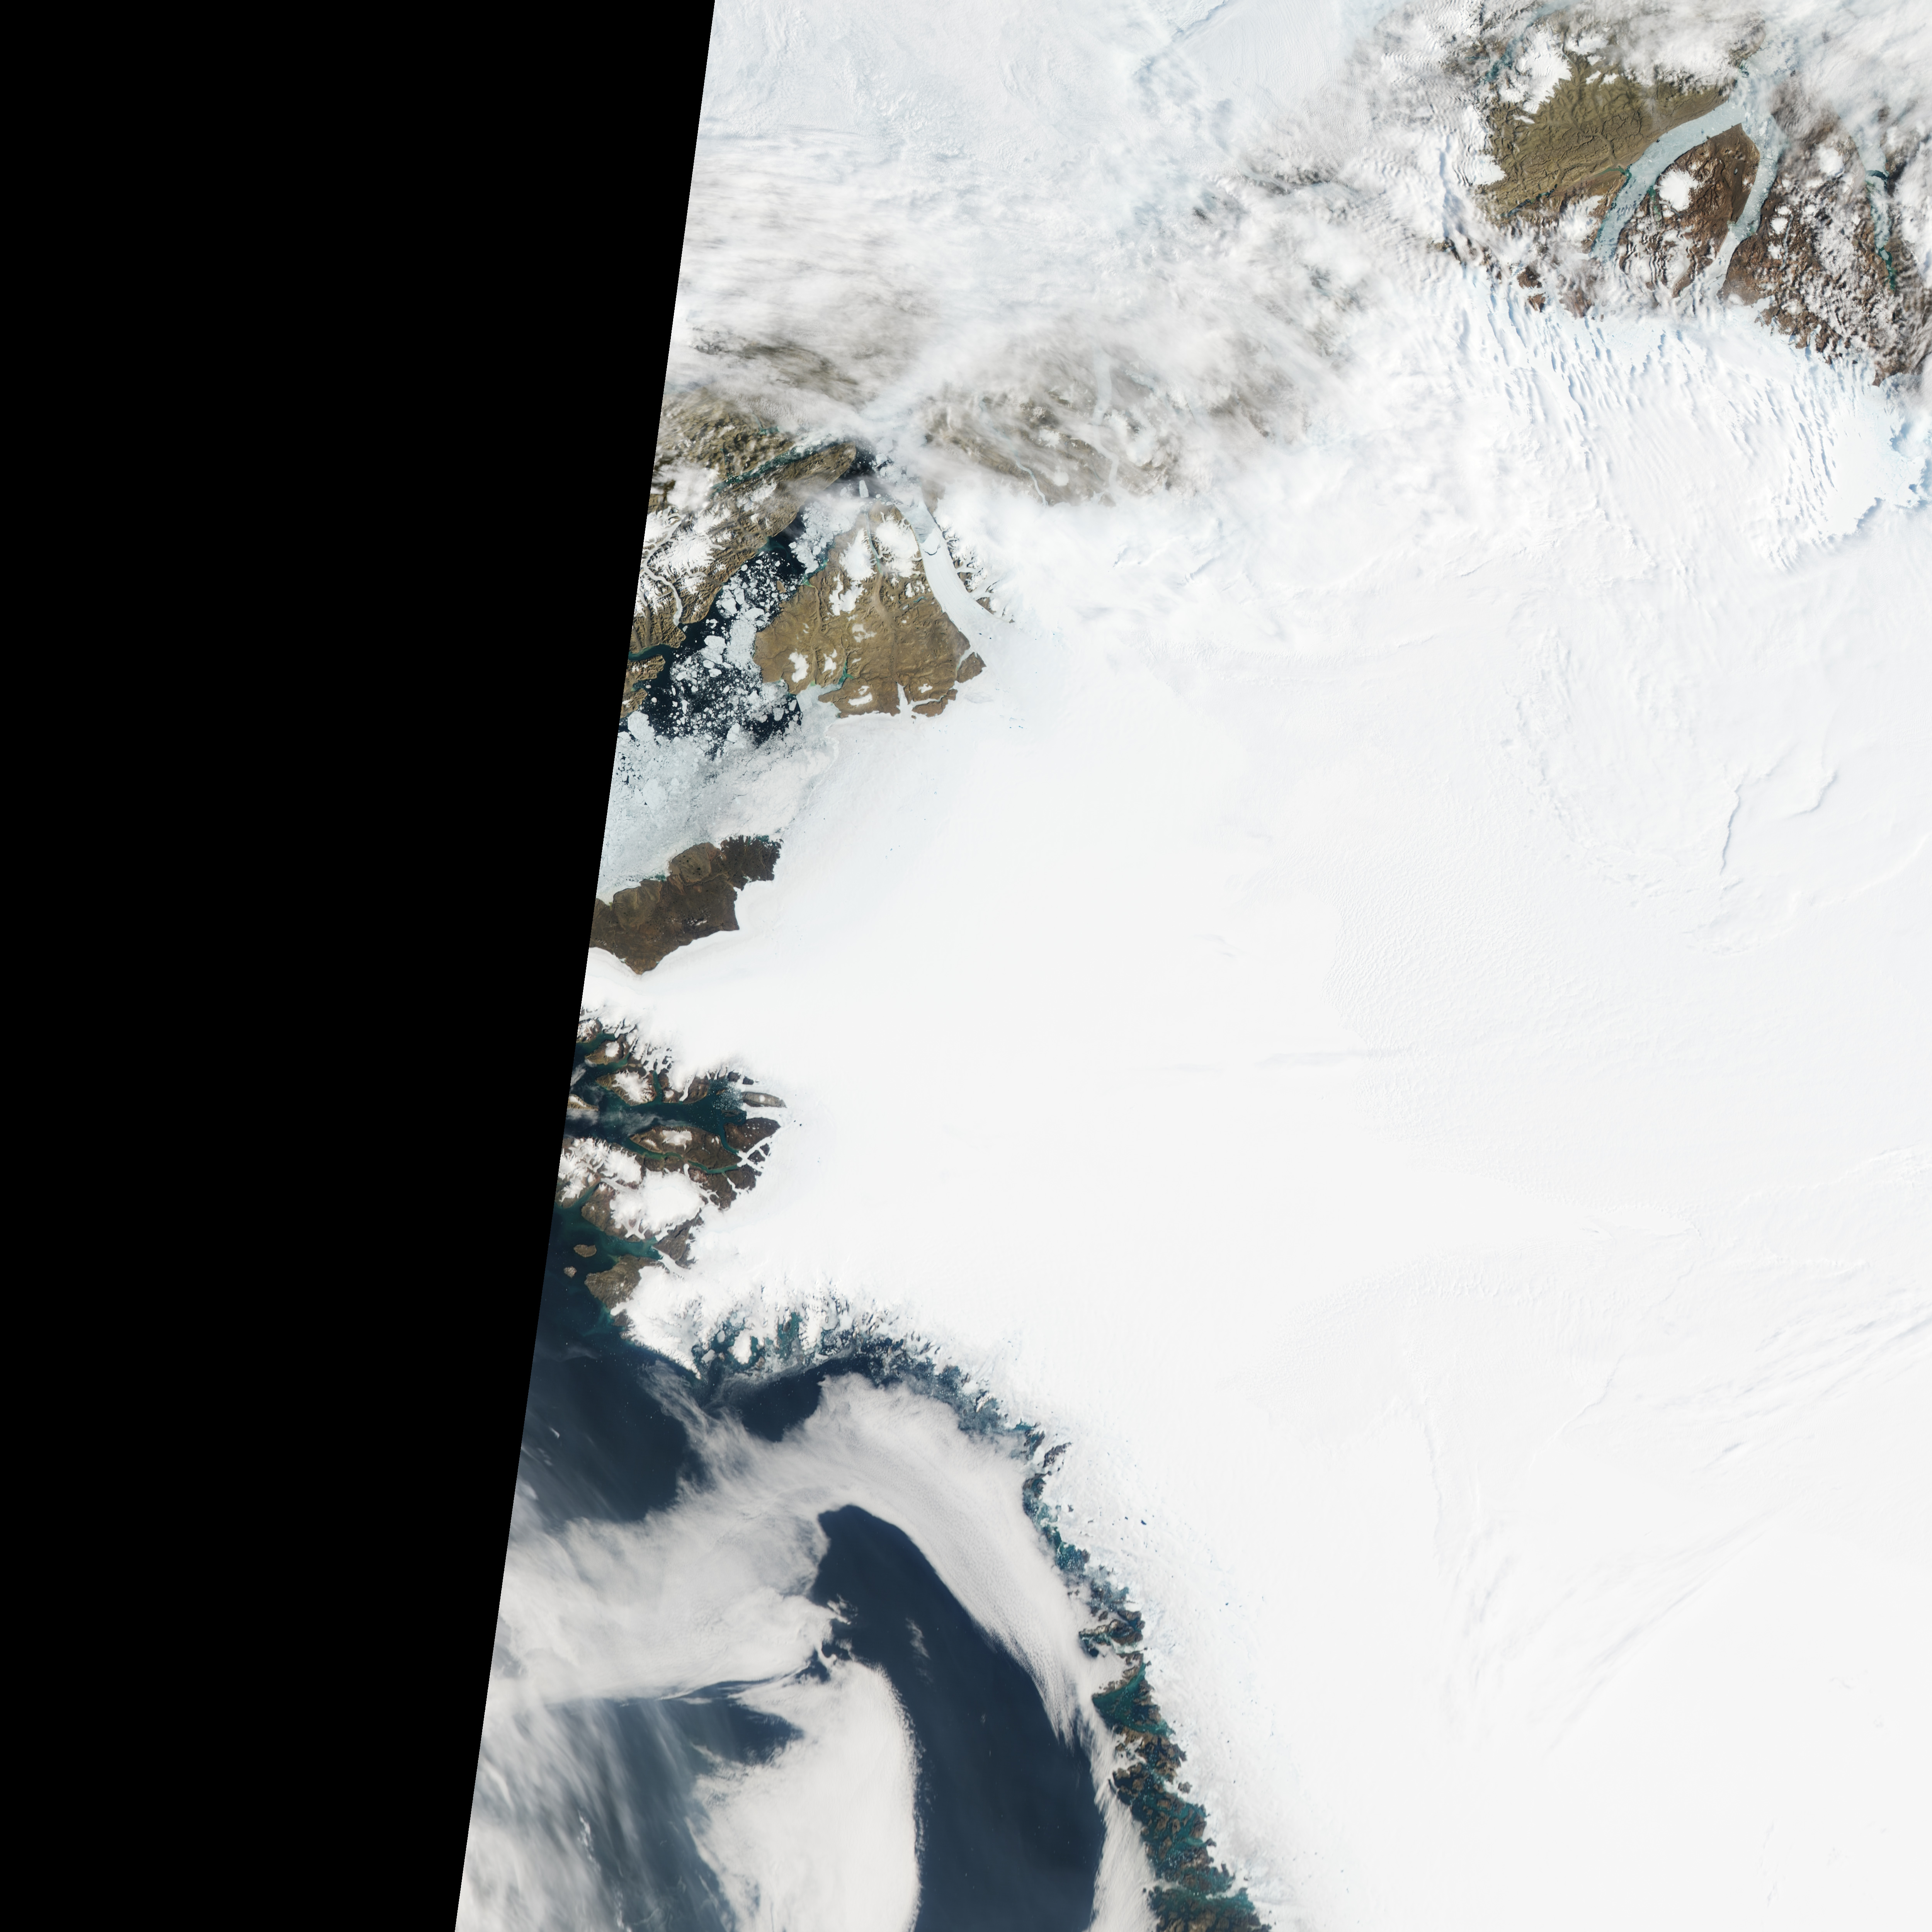
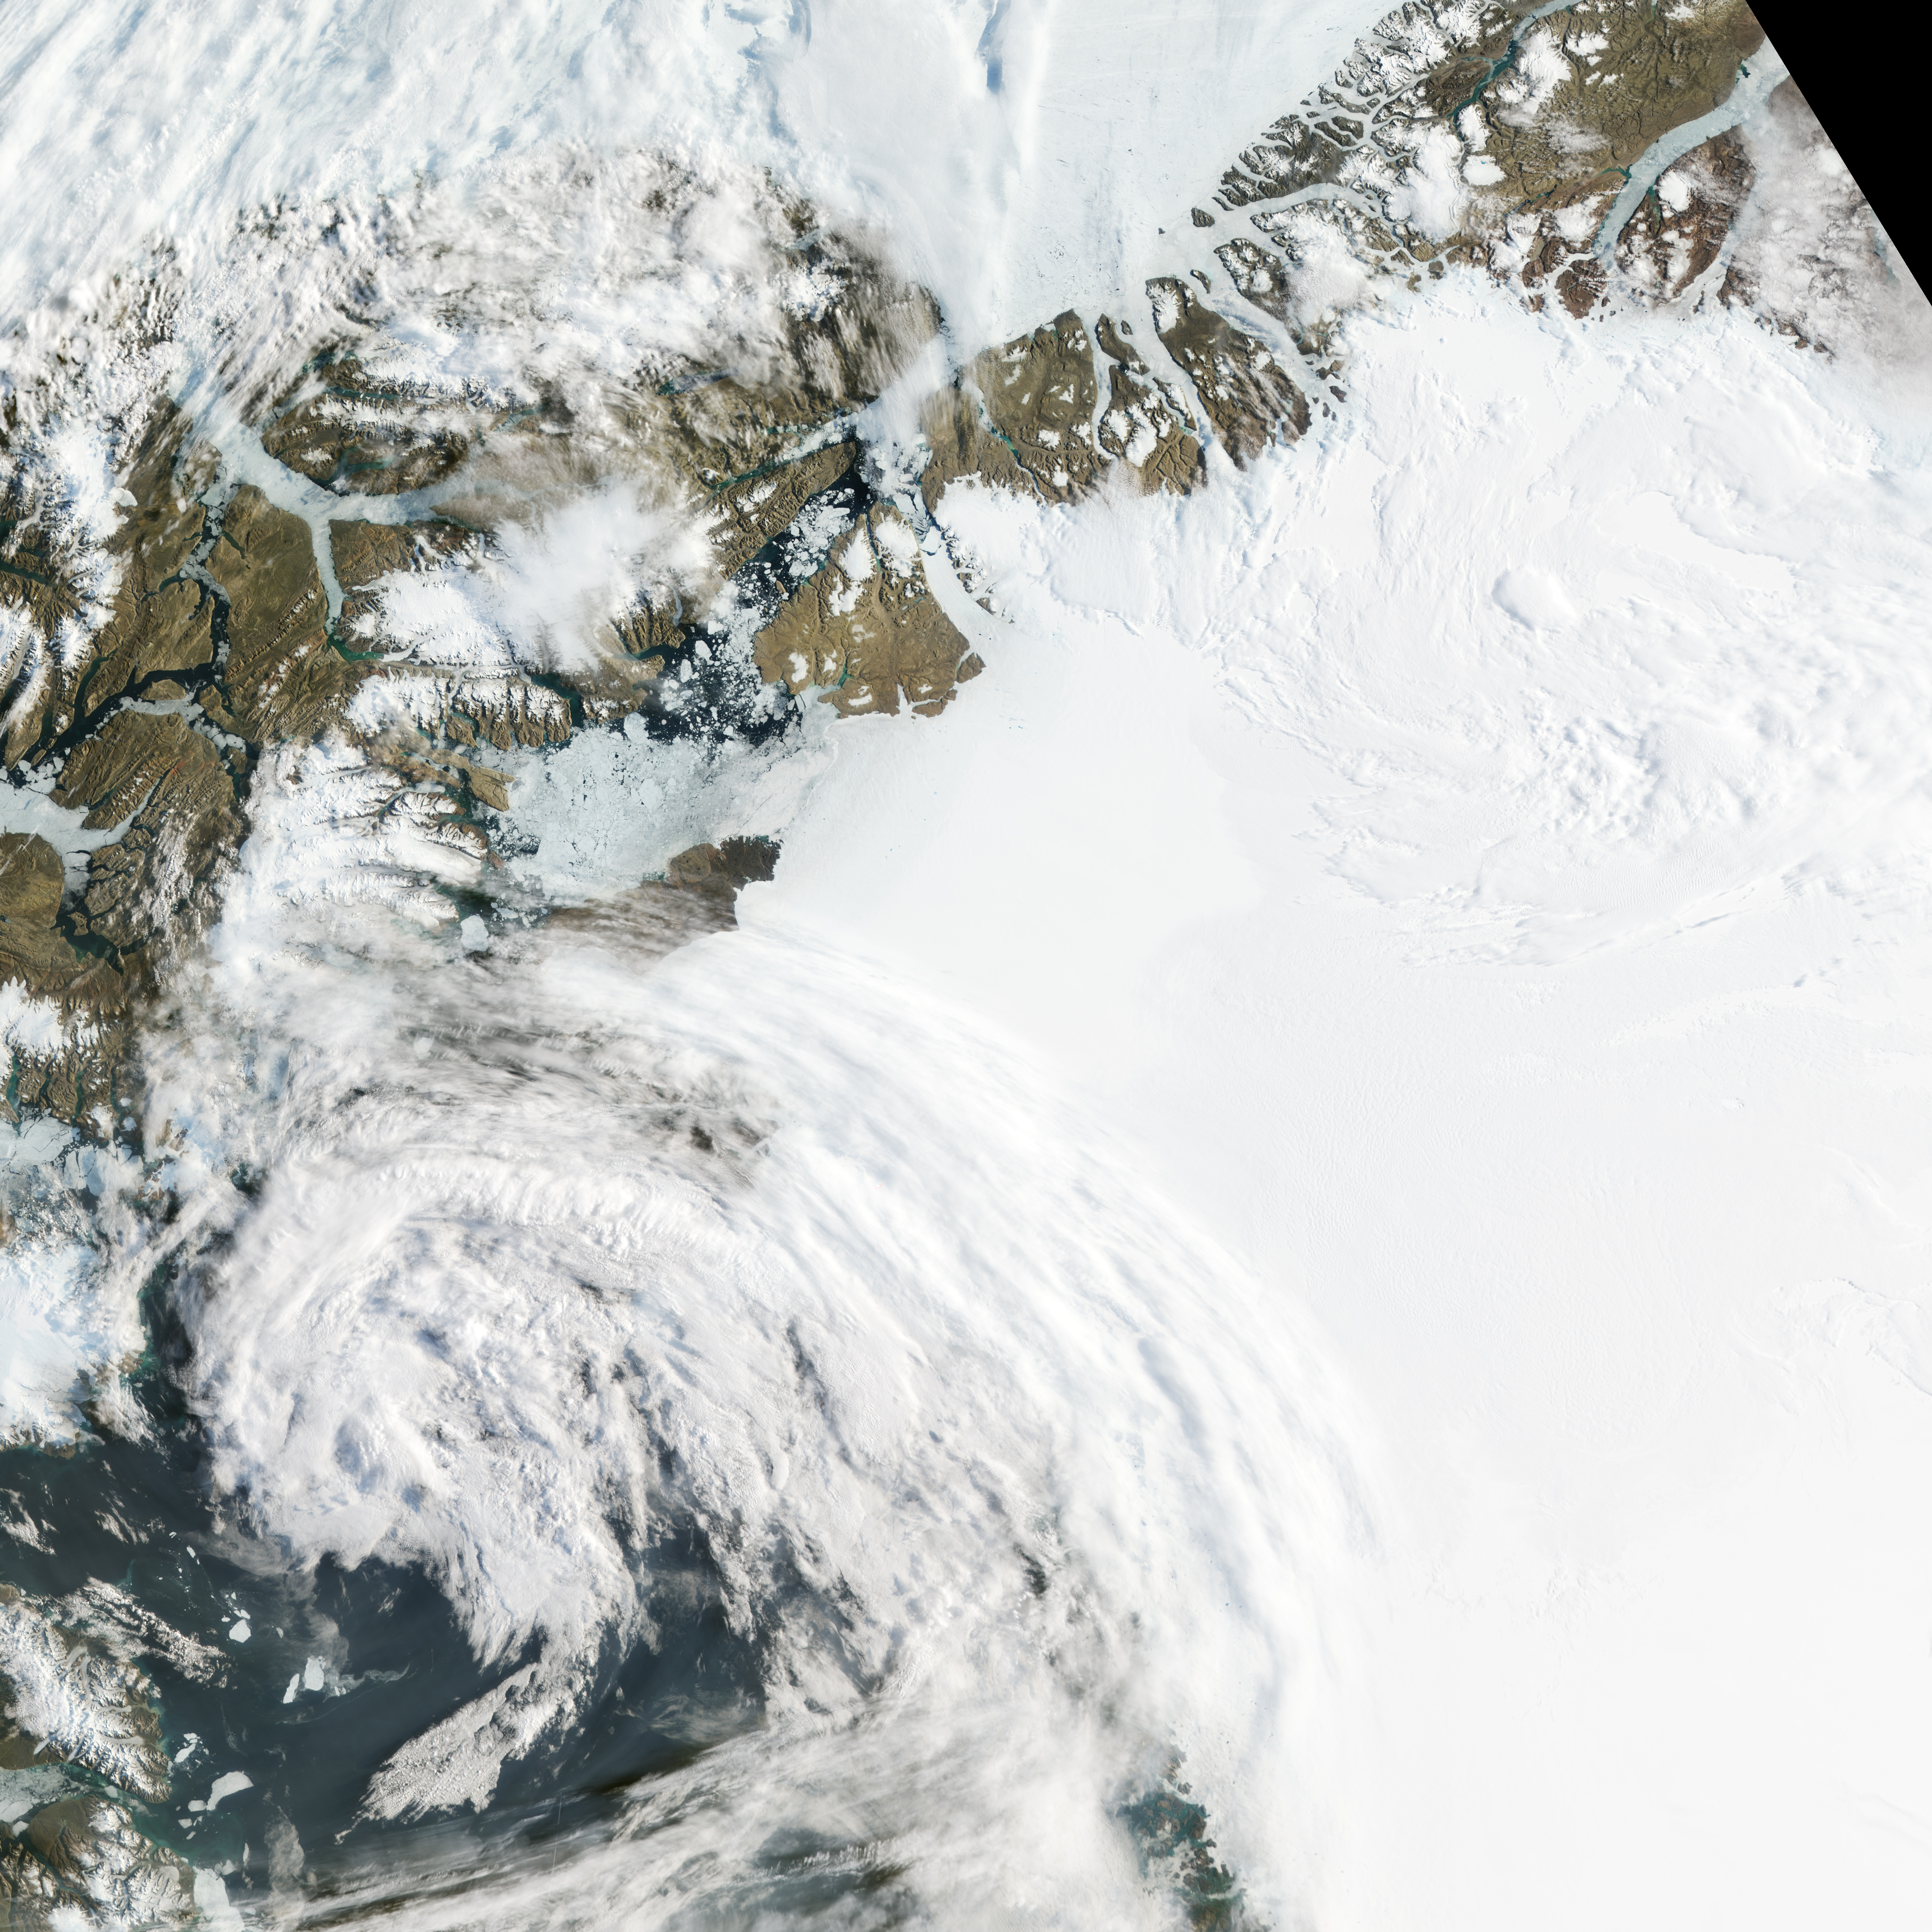
Hi My Friends: A VUELO DE UN QUINDE EL BLOG., The Petermann Glacier grinds and slides toward the sea along the northwestern coast of Greenland, terminating in a giant floating ice tongue. Like other glaciers that end in the ocean, Petermann periodically calves icebergs. A massive iceberg, or ice island, broke off of the Petermann Glacier in 2010. Nearly two years later, another chunk of ice has broken free.

10:25 UTC
acquired July 16, 2012 download large 10:25 UTC image (6 MB, JPEG, 5000x5000)
acquired July 16, 2012 download 10:25 UTC GeoTIFF file (33 MB, TIFF)
12:00 UTC
acquired July 16, 2012 download large 12:00 UTC image (3 MB, JPEG, 5000x5000)
acquired July 16, 2012 download 12:00 UTC GeoTIFF file (20 MB, TIFF)
download large image (7 MB, JPEG, 5000x5000)
acquired July 17, 2012 
 download GeoTIFF file (36 MB, TIFF)

The Petermann Glacier grinds and slides toward the sea along the northwestern coast of Greenland, terminating in a giant floating ice tongue. Like other glaciers that end in the ocean, Petermann periodically calves icebergs. A massive iceberg, or ice island, broke off of the Petermann Glacier in 2010. Nearly two years later, another chunk of ice has broken free.
The Moderate Resolution Imaging Spectroradiometer (MODIS) on NASA’s Aqua satellite observed the new iceberg calving and drifting downstream on July 16–17, 2012. Because Aqua is a polar-orbiting satellite, it makes multiple passes over the Polar Regions each day. At 10:25 Coordinated Universal Time (UTC) on July 16 (top image), the iceberg was still close to the glacier. At 12:00 UTC that same day (middle), the berg had started moving northward down the fjord. Thin clouds partially obscure the downstream view.
One day later, at 09:30 UTC on July 17, Aqua spied a larger opening between the glacier and the iceberg, as well as some breakup of the thinner, downstream ice. The iceberg appears to have made a slight counter-clockwise turn. “The floating extension is breaking apart,” said Eric Rignot of NASA's Jet Propulsion Laboratory and the University of California–Irvine. “It is not a collapse but it is certainly a significant event.”
Konrad Steffen, director of the Swiss Federal Institute for Forest, Snow, and Landscape Research WSL, estimated that this iceberg was roughly half the size of the ice island that calved off of Petermann in 2010.
Ted Scambos, lead scientist at the U.S. National Snow and Ice Data Center, noted that this calving event marks a retreat of the Petermann Glacier “farther back than historical calving fronts.” A comparison of this event to the 2010 event shows that this iceberg broke off the glacier tongue farther upstream. The crack along the southern margin of this new iceberg, however, has been visible in satellite imagery for several years. That rift was first identified in 2001.
  1. Further Reading

  2. Muenchow, A. (2012, July 16) New Petermann Ice Island forming July 16, 2012. Icy Seas. Accessed July 17, 2012.
  3. NASA Earth Observatory (2008, July 28) Ice Island Calves off Petermann Glacier.
  4. NASA Earth Observatory (2008, September 12) Crack in the Petermann Glacier.
  5. Arctic Sea Ice Blog (2012, July 16) Petermann calves again.
NASA Earth Observatory image by Jesse Allen, using data from the Land Atmosphere Near real-time Capability for EOS (LANCE). Caption by Michon Scott with information from Walt Meier and Ted Scambos, National Snow and Ice Data Center; and Konrad Steffen, Swiss Federal Institute for Forest, Snow and Landscape Research.
Instrument: Aqua - MODIS
NASA
Guillermo Gonzalo Sánchez Achutegui
ayabaca@gmail.com 
ayabaca@hotmail.com 
ayabaca@yahoo.com   
Inscríbete en el Foro del blog y participa : A Vuelo De Un Quinde - El Foro!

Mi lista de blogs