Mostrando entradas con la etiqueta Envisat’s Medium Resolution Imaging Spectrometer (MERIS). Mostrar todas las entradas

lunes, 6 de mayo de 2013

Image of the week: Istanbul


Istanbul and the surrounding area in northwestern Turkey are captured in this image acquired by Envisat’s MERIS instrument on 9 June 2011. To the north is the Black Sea, which connects to the Sea of Marmara (centre) via the Bosphorus strait. The Dardanelles strait connects the Marmara to the Aegean Sea (lower left corner). Turkey's largest city, Istanbul, is near the centre of the image at the Bosphorus strait. Istanbul straddles two continents (Europe and Asia), making it a true meeting place of the East and the West. 
Turkey’s location makes it vulnerable to earthquakes, with the 1000 km-long North Anatolian fault just 15 km south of Istanbul. Because earthquakes can suddenly render current maps out of date, satellite images are useful for updating views of how the landscape has been affected as well as creating reference cartography for emergency operations. In addition, before and after satellite images of the area enable authoritative damage assessment as a basis for planning remedial action.
 ESA
Guillermo Gonzalo Sanchez Achutegui
ayabaca@gmail.com
ayabaca@hotmail.com
ayabaca@yahoo.com
Inscríbete en el Foro del blog y participa : A Vuelo De Un Quinde - El Foro!

sábado, 20 de octubre de 2012

ESA - Envisat - Earth from Space: Kimberley


Download:
 Western Australia’s Kimberley region, with a coastline along the Timor Sea, is pictured in this Envisat image. Off the coast in the lower left we can see a group of three coral reefs, known as the Rowley Shoals. Near the centre of the image is King Sound – a large gulf measuring about 120 km long and 50 km wide. On the upper-right side is Australia’s largest artificial lake by volume, Lake Argyle, on the Ord River.

This image was acquired on 28 September 2010 by Envisat’s MERIS instrument. 
Credits: ESA
Western Australia’s Kimberley region, with a coastline along the Timor Sea, is pictured in this Envisat image.

Off the coast in the lower left we can see a group of three coral reefs, known as the Rowley Shoals. Located on the edge of one of the world’s widest continental shelves, each atoll covers an area of 80–90 sq km including lagoons.

Near the centre of the image is King Sound – a large gulf measuring about 120 km long and 50 km wide. A handful of rivers empties into the sound such as the Fitzroy River, one of Australia’s largest watercourses. The port town of Derby lies near the mouth of this river.
King Sound has the highest tides in Australia, reaching a maximum range of over 11 m.
In the Great Sandy Desert to the south, average rainfall can exceed 300 mm. But the high evaporation rate makes up for the higher than normal desert rainfall.
In the lower-right corner we can see Lake Gregory. This inland drainage lake usually holds fresh water, but can become salty after a number of dry years. It is a major migratory area for shorebirds, and provides a breeding habitat for several species of water birds.
On the upper-right side is Australia’s largest artificial lake by volume, Lake Argyle, on the Ord River. The water is used for agriculture, and the lake is recognised as an important wetland area under the Ramsar Convention.
This image was acquired on 28 September 2010 by Envisat’s MERIS instrument.  

The Image of the Week is featured on ESA Web-TV, broadcast online every Friday at 10:00 CEST.
ESA
Guillermo Gonzalo Sánchez Achutegui
ayabaca@gmail.com
ayabaca@hotmail.com
ayabaca@yahoo.com
  Inscríbete en el Foro del blog y participa : A Vuelo De Un Quinde - El Foro!

domingo, 14 de octubre de 2012

ESA Portal: South America’s sombrero uplift

 Sombrero uplift
Download:
In the central Andes mountains, satellites have detected ground deformation under way above a major subterranean magma body.

The Altiplano–Puna volcanic province is part of an active volcanic arc in South America’s central Andes. Extending through Peru, southwestern Bolivia, Chile and northwestern Argentina, it is home to a number of large calderas formed following catastrophic eruptions.
Beneath the surface of Altiplano–Puna, about 17–19 km deep, lies the largest known active magma body in Earth’s continental crust.
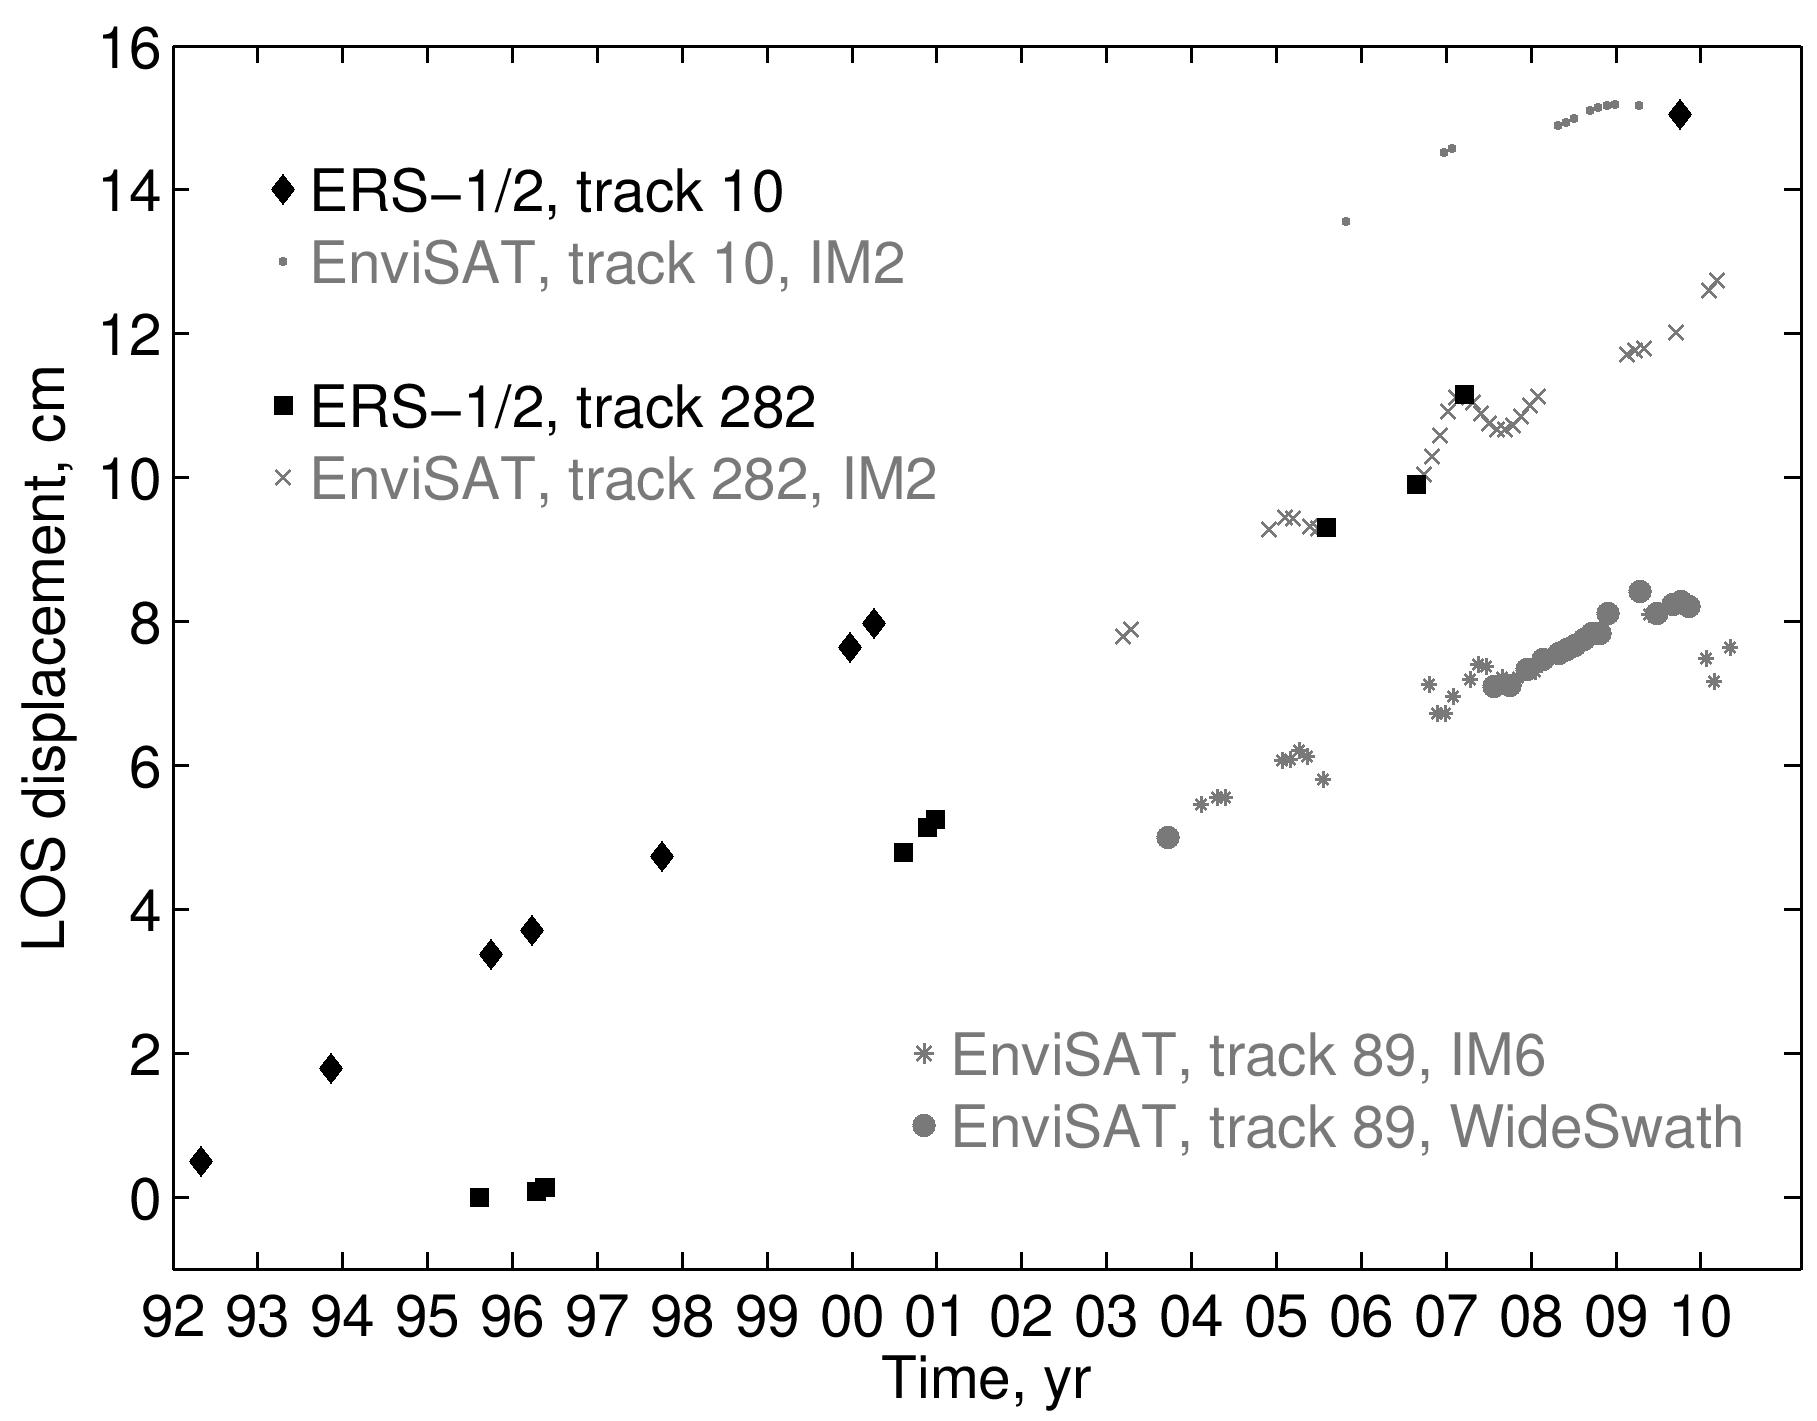
Satellites show that the ground in this area has been rising by about 10 mm per year over the past 20 years.
In a study published today in Science, scientists used radar data from the ERS and Envisat missions to study an unusual uplift near the Uturuncu volcano, which had been dormant for 270 000 years.
The surrounding area, however, is sinking at a slower rate of about 2 mm per year. With the wide-brimmed hat-like shape this creates, the study team has nicknamed this the ‘sombrero uplift’. 


Download:
 HI-RES JPEG (Size: 149 kb)
Displacements calculated using data from ERS (black symbols) and Envisat (grey symbols) over the Altiplano–Puna volcanic province 1992–2010. 
Credits: Y. Fialko, SIO/UCSD
The deformation is attributed to a ballooning of a buoyant volume of molten rock at the top of the Altiplano–Puna magma body.
The authors suggest that much of the melt is being withdrawn from the adjacent parts of the magma body, causing the peripheral subsidence.
The ground deformation was measured using Interferometric Synthetic Aperture Radar – or InSAR – a remote sensing technique where two or more radar images over the same area are combined to detect slight surface changes occurring between acquisitions.
Changes on the ground cause changes in the radar signal and lead to rainbow-coloured interference patterns in the combined image, known as a ‘SAR interferogram’.
In order to get a three-dimensional look at the area of interest, in 2006 the study team asked ESA to task the ERS-2 and Envisat satellites to acquire more data from both the northbound and southbound orbits over Altiplano-Puna.
 Altiplano
Download:
This Envisat image features salt flats in southwest Bolivia, near the crest of the Andes Mountains. The Salar de Uyuni (the lower white area) is the largest salt flat in the world, occupying 10 582 sq km. It is located at the southern end of the Altiplano, a high plain of inland drainage in the central Andes. 
Credits: ESA
 “It was really important to have good data from different lines of sight, as this allowed us to estimate contributions from vertical and horizontal motion of Earth’s surface, and place crucial constraints on depth and mechanism of the inflation source,” said Yuri Fialko, Professor of Geophysics at the University of California San Diego and the lead author of the paper. “Back in 2006, it looked like the satellites stopped acquiring data from the ascending orbits over the area of interest. Fortunately, ESA was very responsive to our requests, and generated an excellent dataset that made our study possible.” 
ESA
Guillermo Gonzalo sánchez Achutegui
ayabaca@gmail.com
ayabaca@hotmail.com
ayabaca@yahoo.com
 Inscríbete en el Foro del blog y participa : A Vuelo De Un Quinde - El Foro!

domingo, 1 de julio de 2012

Earth from Space: Arid Atacama

Hi My Friends: A VUELO DE UN QUINDE EL BLOG., The southern Atacama Desert is pictured in this Envisat image, with the border of Chile (west) and Argentina (east) running down the middle.
 
Download:
 The southern Atacama Desert is pictured in this Envisat image, with the border of Chile (west) and Argentina (east) running down the middle. The Atacama is believed to be the driest desert in the world, and the lack of cloud cover in this image highlights the dry climate.
This image was acquired by Envisat’s MERIS instrument on 4 March 2012. 
Credits: ESA

 The southern Atacama Desert is pictured in this Envisat image, with the border of Chile (west) and Argentina (east) running down the middle.

The Atacama is believed to be the driest desert in the world, and the lack of cloud cover in this image highlights the dry climate.
Just off the coast, the cold surface of the South Pacific Ocean leads to a cooling of air masses, resulting in cloud formation and precipitation over the water. These clouds can clearly been seen in the image, though they rarely reach the land.
This phenomenon is common in several coastal areas such as the North American deserts of the southwestern United States and Mexico, or the Namib Desert on the west coast of southern Africa.
Because of the plateau’s high altitude, low cloud cover and lack of light pollution, it is one of the best places in the world to conduct astronomical observations and home to two major observatories.
Some areas of the desert have been compared to the planet Mars, and have been used as a location for filming scenes set on the red planet.
ESA recently tested a self-steering rover in the Atacama, which was selected for its similarities to martian conditions.
The desert also has rich deposits minerals like copper, and is home to the world’s largest natural supply of sodium nitrate.
East of the desert plateau are the Andes mountains and some greener areas of northern Argentina, though still very arid. The population is concentrated around water courses, water being distributed by canals and irrigation ditches.
This image was acquired by Envisat’s MERIS instrument on 4 March.  

The Image of the Week is featured on ESA Web-TV, broadcast online every Friday at 10:00 CEST.
  ESA.
  Guillermo Gonzalo Sánchez Achutegui
 ayabaca@gmail.com
ayabaca@hotmail.com 
 ayabaca@yahoo.com
 Inscríbete en el Foro del blog y participa : A Vuelo De Un Quinde - El Foro!

domingo, 17 de junio de 2012

The Earth: Earth from Space: Paraná River in Brazil

Hi My Friends: A VUELO DE UN QUINDE EL BLOG., The Paraná River cuts through this image of southern Brazil from the Envisat satellite.

Download:
 HI-RES JPEG (Size: 2178 kb)  HI-RES TIFF (Size: 16 253 kb)
The Paraná River cuts through this image of southern Brazil, acquired by the MERIS instrument on Envisat on 19 March. In the area pictured, the river marks the borders of the Brazilian states of Mato Grosso do Sul to the north and west, São Paulo to the east and Paraná to the south.
Agricultural structures are evident in the surrounding land. Near the centre of the image, smoke from a fire was captured blowing southwest from its source. 
Credits: ESA

The Paraná River cuts through this image of southern Brazil from the Envisat satellite.

In the area pictured, the river marks the borders of the Brazilian states of Mato Grosso do Sul to the north and west, São Paulo to the east and Paraná to the south.
The river along with its tributaries creates a massive watershed that spreads throughout much of the south central part of the continent.
Agricultural structures are evident in the surrounding land. The area is known as a large producer of coffee.
Near the centre of the image, smoke from a fire was captured blowing southwest from its source.
Major fires are visible from space – satellites detect not only the smoke billowing from major conflagrations but also the burn scars left in their wake and even the fires themselves – appearing as hotspots when scanning Earth’s surface in thermal-infrared wavelengths.
Envisat’s Advanced Along-Track Scanning Radiometer was like a thermometer, measuring thermal-infrared radiation to take the temperature of Earth’s land and sea surfaces.
Prior to the end of the Envisat mission in April, the radiometer data contributed to the ATSR World Fire Atlas.
Temperatures exceeding about 39ºC were classed as burning fires by the instrument, which was capable of detecting fires as small as gas flares from industrial sites because of their high temperature. Fires are detected best during local night, when the surrounding land is cooler.
This image was acquired by the MERIS instrument on Envisat on 19 March.
The Image of the Week is featured on ESA Web-TV, broadcast online every Friday at 10:00 CEST. 
 ESA
 Guillermo Gonzalo Sánchez Achutegui
 ayabaca@gmail.com
 ayabaca@hotmail.com
 ayabaca@yahoo.com
Inscríbete en el Foro del blog y participa : A Vuelo De Un Quinde - El Foro!

miércoles, 13 de junio de 2012

Astronomy: Delving inside Earth from space‏

Hi My Friends: A VUELO DE UN QUINDE EL BLOG., ESA astronaut André Kuipers is running experiments on the International Space Station that are shedding light on conditions deep inside Earth. Orbiting some 400 km above us, Geoflow is offering insights into the inner workings of our planet.
Download:
 HI-RES GIF (Size: 1322 kb)
Geoflow data from the International Space Station showing how a liquid between two revolving concentric spheres moves as the temperature between the outer and inner sphere changes.
Six European teams led by the University of Cottbus in Germany recreated aspects of mantle flow in the Geoflow laboratory. Experiments simulating these conditions can verify and improve computer models.
Understanding how Earth’s mantle flows is a major interest for geophysics because it could help to explain earthquakes or volcanic eruptions. The results could also benefit industry by improving spherical gyroscopes, bearings and centrifugal pumps, for example. 
Credits: ESA

ESA astronaut André Kuipers is running experiments on the International Space Station that are shedding light on conditions deep inside Earth. Orbiting some 400 km above us, Geoflow is offering insights into the inner workings of our planet.

Descending 3000 km under our feet, Earth’s mantle is a semi-solid fluid under our thin outer crust. The highly viscous layers vary with temperature, pressure and depth.
Understanding how the mantle flows is a major interest for geophysics because it could help to explain earthquakes or volcanic eruptions. Computers can model it, but how can scientists be sure they are correct?
The deepest that humans have ever drilled is just over 12 km, so investigating the mantle directly is out of reach for th
Download:
 HI-RES JPEG (Size: 4434 kb)
The complete Geoflow laboratory experiment that was installed on the International Space Station. Geoflow is used to verify and improve computer models of fluid convection.
Six European teams led by the University of Cottbus in Germany recreated aspects of mantle flow in the Geoflow laboratory.
Understanding how Earth’s mantle flows is a major interest for geophysics because it could help to explain earthquakes or volcanic eruptions. The results could also benefit industry by improving spherical gyroscopes, bearings and centrifugal pumps, for example. 
Credits: ESA

 Instead of probing Earth’s depths directly, six European teams led by the University of Cottbus in Germany looked to recreate aspects of mantle flow in a laboratory. Experiments simulating these conditions can verify and improve the computer models.
This poses a different problem, however. How can gravity be simulated without Earth’s gravity itself influencing the results?
The solution is to send an experiment to our largest weightless laboratory: the International Space Station.
 Inside the Geoflow experiment two revolving concentric spheres heat a liquid. By observing how the liquid moves in response to temperature differences, scientists are verifying and improving computer models of fluid convection.
The results could benefit industry by improving spherical gyroscopes, bearings and centrifugal pumps, for example. 
Credits: ESA

 Planet in a box

ESA sponsored the development of an experiment that mimics the geometry of a planet. Called Geoflow, it contains two revolving concentric spheres with a liquid between them.
The inner sphere represents Earth’s core, with the outer sphere acting as the crust. The liquid, of course, is the mantle.
 Free from the influence of Earth’s gravity, a high-voltage electrical field creates artificial gravity for the experiment.
As the spheres rotate slowly and a temperature difference is created between the shells, movement in the liquid is closely monitored. The temperatures can be controlled down to a tenth of a degree.
This Envisat radar image features six of Hawaii’s eight major volcanic islands. Visible from right to left are the Big Island of Hawaii, Kahoolawe, Maui, Lanai, Molokai and Oahu. In addition to two other major islands, there are also 124 islets. This image was created by combining three Envisat radar scans (27 March 2006, 16 April 2007 and 21 January 2008) of the same area. The colours in the image result from variations in the surface that occurred between acquisitions. 
Credits: ESA

André has seen plumes of hotter liquid rising towards the outer shell – as predicted by computer simulations.
Mushroom-like plumes in fluids exposed to strong temperature differences might explain the Hawaiian line of volcanoes in the South Pacific.
A better understanding of our planet is not the only outcome of Geoflow. The results could also benefit industry by improving spherical gyroscopes, bearings and centrifugal pumps, for example.
 ESA
 Guillermo Gonzalo Sánchez Achutegui
 ayabaca@gmail.com
 ayabaca@hotmail.com
 ayabaca@yahoo.com
 Inscríbete en el Foro del blog y participa : A Vuelo De Un Quinde - El Foro!

domingo, 3 de junio de 2012

The Earth: Earth from Space: Africa’s largest and highest

Hi My Friends: A VUELO DE UN QUINDE EL BLOG.,  The border region of southern Kenya and northern Tanzania – with a small portion of south eastern Uganda – is pictured in this Envisat image.


Download:
 HI-RES JPEG (Size: 6310 kb
  HI-RES TIFF (Size: 16 158 kb)
The border region of southern Kenya and northern Tanzania – with a small portion of south eastern Uganda – is pictured in this image, acquired by Envisat’s MERIS instrument on 4 January 2012.
In the lower-right portion of the image, we can see the snows of Kilimanjaro, Africa’s highest mountain at 5895 m above sea level. North of Mount Kilimanjaro is Mount Kenya, the second-highest mountain in Africa. The area pictured is part of the East African Rift – an area where two tectonic plates are moving apart from one another – making this home to a number of both active and dormant volcanoes. 
Credits: ESA

 The border region of southern Kenya and northern Tanzania – with a small portion of south eastern Uganda – is pictured in this Envisat image.

Lake Victoria straddles all three countries. Named after Queen Victoria in the mid-1800s, it is the largest African lake by area and supports the continent’s largest inland fishery.
In the lower-right portion of the image, we can see the snows of Kilimanjaro, Africa’s highest mountain at 5895 m above sea level.
This dormant volcano has three volcanic cones: Kibo, Mawenzi and Shira. The last major eruption is believed to have occurred over 300 000 years ago, though Kibo emits gas from an opening in Earth’s crust below it.
North of Mount Kilimanjaro is Mount Kenya, the second-highest mountain in Africa – just above 5000 m. This mountain has 11 small glaciers, but they are rapidly retreating – similar to the ones on Kilimanjaro. Glacial retreat can be caused by changes in the trends of temperature or precipitation.
The area around Mount Kenya is a national park protecting the biodiversity and forming an attractive destination for tourists. The area is home to monkey, antelopes, elephants and leopards.
The area pictured is part of the East African Rift – an area where two tectonic plates are moving apart from one another – making this home to a number of both active and dormant volcanoes.
Most volcanoes around the world are not monitored effectively – or at all. Satellite radars can detect small changes in the ground that may indicate volcanic activity, and can do this on a global scale and in remote or inaccessible areas.
This image was acquired by Envisat’s MERIS instrument on 4 January 2012.
Contact with Envisat was suddenly lost on 8 April and the mission has come to an end. But ten years of Envisat’s archived data will continue to be exploited for studying Earth’s land, atmosphere, oceans and ice caps for years to come.  

The Image of the Week is featured on ESA Web-TV, broadcast online every Friday at 10:00 CEST.
  ESA.
 Guillermo Gonzalo sánchez Achutegui
 ayabaca@gmail.com
 ayabaca@hotmail.com
 ayabaca@yahoo.com
Inscríbete en el Foro del blog y participa : A Vuelo De Un Quinde - El Foro!

domingo, 15 de abril de 2012

The Earth: Watch 'Roof of the world' on the Earth from Space programme‏

Hi My Friends: A VUELO DE UN QUINDE EL BLOG., Frozen lakes dotting the Tibetan Plateau in Central Asia are pictured in this image, acquired on 30 January 2012 by ESA’s Envisat satelliteDownload:
HI-RES JPEG (Size: 2887 kb)
Frozen lakes dotting the Tibetan Plateau in Central Asia are pictured in this image, acquired on 30 January 2012 by ESA’s Envisat satellite.
To its south Tibet is boarded by the Himalayan mountain rage – part of which is visible in the lower-left corner of the image. To the northwest, we can see part of the Kunlun mountains, separating the plateau from the Tarim Basin. Both salt- and freshwater lakes are visible across the steppe – many of which freeze for many months of the year.

Credits: ESA

Earth from Space: Roof of the world:
Frozen lakes dotting the Tibetan Plateau in Central Asia are pictured in this image from ESA’s Envisat satellite. Tibet is the highest and largest plateau in the world, with an area equal to about four times the size of France, and an average elevation exceeding 4500 m.
To its south it is boarded by the Himalayan mountain rage – part of which is visible in the lower-left corner of the image.
To the northwest, we can see part of the Kunlun mountains, separating the plateau from the Tarim Basin.
Both salt- and freshwater lakes are visible across the steppe – many of which freeze for many months of the year.
The plateau becomes progressively higher, colder and drier as is slopes northwest. The Chanthang region in the northwest has an altitude of over 5000 m, and winter temperatures reach -40ºC, making this inhospitable environment one of the least populous regions in the world.
The plateau is also the world’s third largest store of ice, after the Arctic and Antarctic. In recent years, rising temperatures have caused fast-paced melting.
The glacial melt pours into the continent’s largest rivers, such as the Indus and the Ganges. This makes the ice store a vital lifeline for Asian rivers, but while rapid melting causes lakes to expand and floods rivers, it depletes the water source in the long term.
Satellites such as CryoSat, SMOS and Envisat can be used to monitor glacial melting and the water cycle, as well as the effects that climate change has on our planet.
This image was captured on 30 January by the MERIS instrument on the Envisat satellite. The Image of the Week is featured on ESA Web-TV, broadcast online every Friday at 10:00 CET.
Guillermo Gonzalo Sánchez Achutegui
ayabaca@gmail.com
ayabaca@hotmail.com
ayabaca@yahoo.com
Inscríbete en el Foro del blog y participa : A Vuelo De Un Quinde - El Foro!

viernes, 6 de abril de 2012

La Tierra: Envisat es testigo de la rápida desintegración de las barreras de hielo de la Antártida

Hola amigos: A VUELO DE UN QUINDE EL BLOG., El satélite Envisat de la ESA, que acaba de cumplir diez años en órbita, continúa observando cómo una de las barreras de hielo de la Antártida sigue retrocediendo a causa del cambio climático.

Envisat radar image of the Larsen Ice Shelf acquired on 19 March 2012.
Credits: ESA / ENVEO

El satélite Envisat de la ESA, que acaba de cumplir diez años en órbita, continúa observando cómo una de las barreras de hielo de la Antártida sigue retrocediendo a causa del cambio climático. Poco después de su lanzamiento el 1 de marzo de 2002, Envisat enviaba imágenes de la separación de una gran parte de la barrera de hielo Larsen B en la Antártida. 3 200 kilómetros cuadrados de hielo se desintegraron en cuestión de días debido a las inestabilidades mecánicas provocadas por el calentamiento de la región.
Tras diez años monitorizando la barrera con su Radar Avanzado de Apertura Sintética (ASAR), Envisat ha sido testigo de cómo Larsen B perdía otros 1 790 kilómetros cuadrados a lo largo de una década.

La barrera de hielo Larsen está compuesta por tres secciones – Larsen A (la más pequeña), B y C (la mayor) – que se extienden de norte a sur a lo largo del litoral oriental de la península Antártica.
Larsen A se desintegró en enero de 1995. Larsen C había mantenido una extensión más o menos estable, pero las medidas realizadas con la ayuda de los satélites desvelan que está perdiendo espesor y que la duración del deshielo estival no ha dejado de aumentar.
“Las barreras de hielo son muy sensibles al calentamiento de la atmósfera y a los cambios en la temperatura o en las corrientes de los océanos”, explica el profesor Helmut Rott de la Universidad de Innsbruck.
“La temperatura atmosférica al norte de la península Antártica ha aumentado unos 2.5°C a lo largo de los últimos 50 años - un incremento bastante superior a la media global - que está provocando el retroceso y la desintegración de las barreras de hielo”.
La extensión de la barrera Larsen B pasó de 11 512 kilómetros cuadrados en enero de 1995 a 6 664 en febrero de 2002, tras una larga serie de desprendimientos. Tras el colapso de marzo de 2002, su extensión se redujo a 3 463. A día de hoy, Envisat muestra que Larsen B cuenta con una superficie de tan sólo 1 670 kilómetros cuadrados.
Download:
HI-RES JPEG (Size: 790 kb)
HI-RES TIFF (Size: 25 445 kb)
Launched in 2002, Envisat is the largest Earth observation satellite ever built.

Credits: ESA
Envisat lleva operativo el doble del tiempo inicialmente designado para su misión, y está previsto que continúe observando los campos de hielo, los océanos, la atmósfera y la superficie de nuestro planeta un mínimo de dos años más.
Esto permitirá garantizar la continuidad de los datos de observación de la Tierra hasta que la próxima generación de satélites – los Sentinel – entre en servicio en el año 2013.
“Las observaciones sistemáticas a largo plazo son muy importantes para comprender y modelar mejor los procesos de la criosfera, lo que nos permite mejorar la capacidad de predicción de cómo responderán la nieve y el hielo ante el cambio climático”, explica Rott.
This image of the Larsen B ice shelf is one of the first photos taken by Envisat on 18 March 2002. Prior to Envisat’s launch, ERS-1 and -2 had been monitoring changes in the region. Together with ERS data, this image (orbit 250) documents the 100-km retreat of the Larsen B ice shelf. Today, Envisat's radar continues to make regular, all-weather observations to enable detailed studies of the extent, surface motion and surface melt of all the ice shelves around Antarctica.

Credits: ESA
http://download.esa.int/multimedia/earthobservation/larsen-2002-2012-animation_H.gif
“Los modelos climáticos actuales predicen un calentamiento drástico a altas latitudes. Los datos recogidos por Envisat sobre la barrera de hielo Larsen confirman la gran vulnerabilidad de estas plataformas, y ponen de manifiesto la importancia de su papel en la estabilización de los glaciares que se encuentran aguas arriba”.
“Estas observaciones son muy importantes para estimar cómo se comportarán las grandes masas de hielo de la Antártida Occidental si el calentamiento continúa avanzando hacia el sur”.
Los radares de los satélites de observación de la Tierra, tales como ASAR, a bordo de Envisat, son particularmente útiles para monitorizar las regiones polares, ya que son capaces de observar la superficie de nuestro planeta a través de la cobertura de nubes o en la oscuridad.
Las misiones Sentinel – desarrolladas dentro del programa europeo para la Monitorización Mundial del Medioambiente y la Seguridad (GMES) – continuarán el legado de la observación de la Tierra con tecnología radar. ESA
Guillermo Gonzalo Sánchez Achutegui
ayabaca@gmail.com
ayabaca@hotmail.com
ayabaca@yahoo.com
Inscríbete en el Foro del blog y participa : A Vuelo De Un Quinde - El Foro!

domingo, 4 de marzo de 2012

Astronomía: ¡Feliz cumpleaños, Envisat!

Hola amigos: A VUELO DE UN QUINDE EL BLOG., En la madrugada del 1 de marzo de 2002, el mayor satélite de observación de la Tierra de la historia despegaba desde el Puerto Espacial Europeo en Kourou, Guayana Francesa. Durante esta década, Envisat no ha dejado de velar por nuestro planeta.

A mosaic of Envisat ASAR radar images acquired between 9 and 11 September 2011 over the Arctic Ocean. The sea-ice extent highlighted in blue corresponds to the areas where more than 80% of the sea surface is covered by ice (from an analysis performed by the US National Ice Center). The Arctic is one of the most inaccessible regions on Earth, so obtaining measurements of sea ice was difficult before the advent of satellites.


En la madrugada del 1 de marzo de 2002, el mayor satélite de observación de la Tierra de la historia despegaba desde el Puerto Espacial Europeo en Kourou, Guayana Francesa. Durante esta década, Envisat no ha dejado de velar por nuestro planeta. Este satélite de ocho toneladas lleva operativo el doble del tiempo inicialmente previsto para su misión, de 5 años, completando más de 50 000 órbitas entorno a la Tierra.
Gracias a sus diez instrumentos ópticos y radar, Envisat observa y monitoriza de forma continua la superficie de la tierra, la atmósfera, los océanos y los campos de hielo. Durante esta década, se han publicado más de 2000 artículos científicos basados en sus resultados.

El mayor instrumento de Envisat es el Radar Avanzado de Apertura Sintética, ASAR, que opera día y noche gracias a su capacidad de observar la superficie del planeta a través de la cobertura de nubes o en la oscuridad. Este instrumento es particularmente útil para monitorizar la evolución de las regiones polares, que permanecen sumidas en la oscuridad durante meses y en las que el mal tiempo es algo habitual.
El verano pasado, ASAR detectó que la extensión del hielo marino que flota sobre el Ártico había alcanzado un mínimo histórico.
El espectrómetro MERIS analiza el color de los océanos y la cobertura del terreno.
Sus imágenes se utilizan para generar mapas de alta resolución de la cobertura del terreno a escala global, dentro del proyecto GlobCover. Estos mapas resultan de gran utilidad para evaluar los efectos del cambio climático, para ayudar en los esfuerzos de protección de la biodiversidad y para mejorar la gestión de los recursos naturales.
Download:
HI-RES JPG (Size: 1999 kb)
HI-RES TIFF (Size: 7 122kb)
Envisat’s Sciamachy imaging spectrometer performs global measurements of trace gases in the troposphere and stratosphere. This map of mean tropospheric nitrogen dioxide concentration was created using data from January 2003 to June 2004. Image produced by S. Beirle, U. Platt and T. Wagner of the University of Heidelberg's Institute for Environmental Physics.

Credits: University of Heidelberg

El conjunto formado por los instrumentos MIPAS, SCIAMACHY y GOMOS analiza las nubes de contaminantes que cubren las principales zonas industriales o los incendios forestales, y es capaz de monitorizar la evolución de los agujeros en la capa de ozono.
Estos tres instrumentos observan de forma simultánea la atmósfera, generando detallados perfiles horizontales y verticales de la distribución de una gran variedad de compuestos químicos.
El radiómetro avanzado ATSR es capaz de medir la temperatura de la superficie de la tierra y de los océanos al medir la radiación térmica-infrarroja emitida por nuestro planeta. Entre los datos que genera, el Atlas Mundial de Incendios es uno de los más destacados.

The ESA global detection of hot spots by ERS-2’s Along-Track Scanning Radiometer (ATSR-2) and Envisat’s Advanced Along-Track Scanning Radiometer (AATSR) in 2005. These twin radiometers work like thermometers in the sky, measuring thermal infrared radiation to take the temperature of Earth’s land surfaces. Temperatures exceeding 312K (38.85ºC) are classed as burning fires. Credits: ESA


Entre los instrumentos de Envisat también se encuentra el Altímetro Radar, capaz de medir la topografía de la superficie terrestre con una precisión de unos pocos centímetros, lo que hace posible analizar la evolución temporal del nivel del mar.
Envisat no sólo proporciona datos de observación de la Tierra a la comunidad científica; hay un gran número de servicios operacionales basados en sus resultados, tales como los mapas de la evolución del hielo marino o de los vertidos de crudo.
Para mantener esta sofisticada misión en marcha, hacen falta científicos e ingenieros altamente cualificados – Envisat debe su década de éxitos a más de diez años de trabajo en equipo.
Para hacer frente a una creciente demanda de información por parte de la comunidad científica, la misión incrementó gradualmente el flujo de datos durante sus primeros cinco años en órbita. Durante este tiempo, se ha optimizado la infraestructura de tierra para mejorar la calidad y acelerar la recepción de datos.

1 March 2002: Envisat soars into orbit.

Credits: ESA/CNES/Arianespace-S. Corvaja


Tres años más tarde, se presentó el primer análisis global de los gases de efecto invernadero en un nuevo simposio dedicado a Envisat. Este estudio demostró la variación estacional de la concentración de metano y la acumulación de dióxido de carbono en la atmósfera. Download:
HI-RES JPEG (Size: 1150 kb)


HI-RES TIFF (Size: 45 452 kb)
Phytoplankton are the base of the marine food chain, and play a huge role in the removal of carbon dioxide from the atmosphere and the production of oxygen in the oceans. Different types and quantities of phytoplankton exhibit different colours. The MERIS instrument on Envisat can monitor these algal blooms. Once a bloom begins, the ocean colour sensor can make an initial identification of its chlorophyll pigment, and therefore its species and toxicity. Since phytoplankton are sensitive to environmental changes, it is important to monitor and model them for climate change calculations and to identify potentially harmful blooms.


Credits: ESA
MERIS: floración de plancton
En el año 2010, se decidió cambiar la órbita de Envisat para permitir que continuase operando durante al menos tres años más.
Esto permite garantizar la continuidad de los datos de observación de la Tierra hasta que la próxima generación de satélites – los Sentinels – esté plenamente operativa en el año 2013.
Las misiones Sentinel están siendo desarrolladas dentro del programa europeo para la Monitorización Mundial del Medioambiente y la Seguridad (GMES).
Para saber más sobre los logros de Envisat, pueden visitar la


página creada para celebrar su décimo aniversario.
Guillermo Gonzalo Sánchez Achutegui
ayabaca@gmail.com


ayabaca@hotmail.com


ayabaca@yahoo.com


Inscríbete en el Foro del blog y participa : A Vuelo De Un Quinde - El Foro!

lunes, 16 de enero de 2012

Science: Earth from Space: A southern summer bloom

Hi My Friends: A VUELO DE UN QUINDE EL BLOG., In this Envisat image, a phytoplankton bloom swirls a figure-of-8 in the South Atlantic Ocean about 600 km east of the Falkland Islands.HI-RES JPEG (Size: 770 kb)

HI-RES TIFF (Size: 12 179 kb)
In this Envisat image, acquired on 2 December 2011, a phytoplankton bloom swirls a figure-of-8 in the South Atlantic Ocean about 600 km east of the Falkland Islands. Different types and quantities of phytoplankton exhibit different colours, such as the blues and greens in this image.
Earth-observing satellites like Envisat can monitor these algal blooms. Once a bloom begins, an ocean colour sensor can make an initial identification of its chlorophyll pigment, and therefore its species and toxicity.

Credits: ESA

During this period in the southern hemisphere, the ocean becomes rich in minerals from the mixing of surface waters with deeper waters. Phytoplankton depend on these minerals, making blooms like this common in the spring and summer.
These microscopic organisms are the base of the marine food chain, and play a huge role in the removal of carbon dioxide from the atmosphere and the production of oxygen in the oceans. By helping to regulate the carbon cycle, phytoplankton are important to the global climate system.
Different types and quantities of phytoplankton exhibit different colours, such as the blues and greens in this image.
Earth-observing satellites like Envisat can monitor these algal blooms. Once a bloom begins, an ocean colour sensor can make an initial identification of its chlorophyll pigment, and therefore its species and toxicity.
Since the phytoplankton are sensitive to environmental changes, it is important to monitor and model them for climate change calculations and to identify potentially harmful blooms.
Envisat’s MERIS instrument acquired this image on 2 December 2011 at a resolution of 300 m. ESA
Guillermo Gonzalo Sánchez Achutegui
ayabaca@gmail.com
ayabaca@hotmail.com
ayabaca@yahoo.com
Inscríbete en el Foro del blog y participa : A Vuelo De Un Quinde - El Foro!

viernes, 18 de noviembre de 2011

ASTRONOMÍA: La Tierra vista desde el espacio: el volcán submarino de El Hierro

Hola amigos A VUELO DE UN QUINDE EL BLOG., la Agencia Espacial Europea ESA, nos informa de una gran imagen de la Erupción del Volcán submarino de El Hierro, enfocado gracias al Satélite Envisat.An active, underwater volcano just off the southern coast of the Canary island, El Hierro, is pictured in this image, acquired on 9 November 2011 by Envisat’s Medium Resolution Imaging Spectrometer (MERIS). The volcanic plume has discoloured the surrounding waters and the muddy water has reached El Hierro’s shores. Credits: ESA

El satélite Envisat de la ESA nos muestra esta semana la erupción del volcán submarino de El Hierro vista desde el espacio. La columna volcánica ha creado una gran mancha en la superficie del mar, y los lodos se extienden hasta alcanzar las costas de la isla.
Los habitantes de El Hierro están sufriendo decenas de terremotos cada día, y han avistado peces muertos flotando en la costa.
Recientemente han empezado a aflorar burbujas de gases volcánicos, lanzando agua a varios metros sobre la superficie del mar. El riesgo de emisión de gases tóxicos ha obligado a las autoridades a cerrar algunas de las playas de la isla.
El archipiélago de las Islas Canarias, de origen volcánico, está formado por siete islas principales – algunas de las cuales se pueden ver en esta imagen – y por varios islotes de menor tamaño.
Esta imagen fue tomada el pasado día 9 de noviembre por el espectrómetro MERIS de Envisat.
El programa online ESA Web-TV, inaugurado hoy y que se emitirá cada viernes a las 10:00 CET, destacó esta imagen en su primera edición.
ArchiveImage archive Earth images gallery
Related missionsEnvisat overview ESA Web-TV
Guillermo Gonzalo Sánchez Achutegui
ayabaca@gmail.com
ayabaca@hotmail.com
ayabaca@yahoo.com
Inscríbete en el Foro del blog y participa : A Vuelo De Un Quinde - El Foro!

Mi lista de blogs