Mostrando entradas con la etiqueta the National Center for Atmospheric Research (NCAR). Mostrar todas las entradas

domingo, 22 de enero de 2017

The National Science Foundation (NSF) : Atmospheric scientists take to the skies to test cloud seeding for snow .- Los científicos de la atmósfera toman el cielo para probar la siembra de nubes para la nieve.....

https://www.nsf.gov/news/news_summ.jsp?cntn_id=190748&WT.mc_id=USNSF_51&WT.mc_ev=click

Researchers study whether cloud seeding increases snowfall

Pilots from Weather Modification, Inc., prepare the cloud seeding aircraft with seeding flares.

Pilots from Weather Modification, Inc., prepare the cloud seeding aircraft with seeding flares.
Credit and Larger Version

January 13, 2017
Can cloud seeding -- dispersing particles into the air with the aim of increasing precipitation -- increase snowfall? This week, a team of researchers began a cloud-seeding project in southwestern Idaho to answer that question.
Cloud seeding is a process by which artificial ice nuclei, such as silver iodide particles, are released into clouds, either from the air or via ground-based generators.
The Idaho project, funded by the National Science Foundation (NSF) and dubbed SNOWIE (Seeded and Natural Orographic Wintertime Clouds -- the Idaho Experiment), will run from January 7 to March 17 in and around the Payette Basin, 50 miles north of Boise.
"Scientists are still uncertain about cloud seeding for increasing precipitation, despite ongoing operations around the globe," says Nick Anderson, program director in NSF's Division of Atmospheric and Geospace Sciences. "SNOWIE is the most comprehensive study to date on cloud seeding in winter."
 
More snow?
 
Snow from winter storms develops when ice crystals form on dust and other particles known as "ice nuclei." In many storms, the lack of natural ice nuclei at warmer temperatures results in less precipitation. In addition, weak updrafts in clouds and other factors limit the ability of ice nuclei to form.
In some areas affected by droughts, cloud seeding may increase mountain snowfall and, ultimately, water supplies for communities and for crop irrigation. Water resource managers, hydropower companies and agriculture businesses usually pay for the practice, seeing it as a potential way of alleviating water shortages.
"SNOWIE researchers have an array of advanced instrumentation and modeling to focus on the fine-scale aspects of clouds to determine whether seeding operations are resulting in precipitation enhancement," Anderson says. "Improved information about cloud seeding, and winter precipitation in general, is especially important for water resources, such as those related to hydropower and for agriculture."
 
SNOWIE: A multi-institution collaboration
 
SNOWIE researchers, led by atmospheric scientist Jeff French of the University of Wyoming, are working in concert with the Boise-based Idaho Power Company, which obtains a large amount of its power through hydroelectric dams. The company is covering the cost of cloud seeding and some instrumentation.
"Idaho Power is interested in putting more snow on the ground in the mountains, which leads to more water in rivers from snowmelt," says French. "In turn, that leads to more power generation capability throughout the year."
Researchers aboard an aircraft provided by Idaho Power will release silver iodide into the atmosphere, while scientists on the NSF-funded University of Wyoming King Air plane will take measurements to help understand the effects. The King Air is a twin turbo-prop aircraft designed and used for atmospheric research.
Along with University of Wyoming researchers and the Idaho Power Company, scientists at the University of Colorado, the University of Illinois at Urbana-Champaign, the National Center for Atmospheric Research (NCAR) and the Center for Severe Weather Research are participating in SNOWIE.
The project has a series of intensive observation periods, during which the researchers will obtain measurements while cloud seeding is happening and when it's not.
"Part of understanding seeding is understanding the natural processes of a winter storm," French says. "It's important to be out there during a storm's evolution to take measurements even when seeding is not occurring."
 
Research in the air and on the ground
 
While much of the research will take place aboard the King Air, some will take place on the ground. The team will model precipitation using the Cheyenne supercomputer at the NCAR-Wyoming Supercomputing Center. The models will simulate clouds and snowfall -- created in natural storms and with cloud seeding -- over the Payette Basin.
"Results from SNOWIE will lead to a new and important understanding of cold-season precipitation -- both natural precipitation and precipitation augmented through cloud seeding -- and will have an impact throughout the American West, a region that increasingly suffers from drought and water shortage," French says.
For more on NSF-supported snow projects, please see The Science of Winter.
-NSF-

Media Contacts Cheryl Dybas, NSF, (703) 292-7734,
 cdybas@nsf.gov
Ron Podell, University of Wyoming, (307) 766-2929,
 rpodell@uwyo.edu


The National Science Foundation (NSF) is an independent federal agency that supports fundamental research and education across all fields of science and engineering. In fiscal year (FY) 2016, its budget is $7.5 billion. NSF funds reach all 50 states through grants to nearly 2,000 colleges, universities and other institutions. Each year, NSF receives more than 48,000 competitive proposals for funding and makes about 12,000 new funding awards. NSF also awards about $626 million in professional and service contracts yearly.
 Get News Updates by Email 
Useful NSF Web Sites:
NSF Home Page: https://www.nsf.gov
NSF News: https://www.nsf.gov/news/
For the News Media: https://www.nsf.gov/news/newsroom.jsp
Science and Engineering Statistics: https://www.nsf.gov/statistics/
Awards Searches: https://www.nsf.gov/awardsearch/

The NSF-supported University of Wyoming King Air research plane taxis across an icy tarmac.
Credit and Larger Version
A Doppler-on-Wheels radar unit operates from a remote mountaintop location, requiring a lot of shoveling.
A Doppler-on-Wheels radar unit operates from a remote mountaintop location.
Credit and Larger Version
Researchers from the University of Illinois at Urbana-Champaign prepare to launch an instrument package.
Researchers prepare to launch an instrument package.
Credit and Larger Version
Snow gauges, operated by the National Center for Atmospheric Research, measure how much snow falls.
Credit and Larger Version
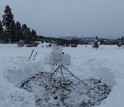
A radiometer from the University of Colorado measures how much supercooled liquid clouds contain.
Credit and Larger Version
The National Science Foundation (NSF)

Guillermo Gonzalo Sánchez Achutegui
ayabaca@gmail.com
ayabaca@hotmail.com
ayabaca@yahoo.com
Inscríbete en el Foro del blog y participa : A Vuelo De Un Quinde - El Foro!
jueves, 8 de diciembre de 2016

The National Science Foundation (NSF) : Extreme downpours could increase 400 percent across parts of U.S..- Las lluvias extremas podrían aumentar 400 por ciento a través de partes de EE.UU.........

https://www.nsf.gov/news/news_summ.jsp?cntn_id=190537&WT.mc_id=USNSF_51&WT.mc_ev=click


A warming climate could also boost individual storm intensity

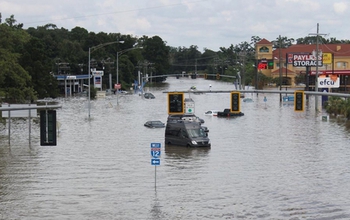
The August, 2016, floods in Baton Rouge, Louisiana, wreaked havoc throughout the area.

The August, 2016, floods in Baton Rouge, Louisiana, wreaked havoc throughout the area.
Credit and Larger Version

December 5, 2016
By century's end, the number of summertime storms that produce extreme downpours could increase by more than 400 percent across parts of the United States -- including sections of the Gulf Coast, Atlantic Coast, and the Southwest -- according to a new study funded by the National Science Foundation (NSF).
The study, by scientists at the National Center for Atmospheric Research (NCAR) and published today in the journal Nature Climate Change, also reports that the intensity of individual extreme rainfall events could increase by as much as 70 percent in some areas.
"These are huge increases," said NCAR scientist Andreas Prein, lead author of the study. "Imagine the most intense thunderstorm you typically experience in a single season. Our study finds that, in the future, parts of the U.S. could expect to experience five of those storms in a season, each with an intensity as strong, or stronger, than current storms."
Anjuli Bamzai, a program director in NSF's Geosciences Directorate, added that the research has potential public safety benefits. "Extreme precipitation events affect our infrastructure through flooding, landslides and debris flows. We need to better understand how these extreme events are changing. By supporting this research, NSF is working to foster a safer environment for all of us."

Storms and supercomputers

An increase in extreme precipitation is one of the expected effects of climate change. Scientists know that as the atmosphere warms, it can hold more water, and a wetter atmosphere can produce heavier rain. Researchers have already measured an increase in precipitation intensity across all regions of the U.S.
However, climate models are generally unable to simulate these downpours, making it difficult for researchers to assess future changes in storm frequency and intensity.
For the new study, the team used a dataset created when NCAR scientists and study co-authors Roy Rasmussen, Changhai Liu, and Kyoko Ikeda employed a Weather Research and Forecasting (WRF) model with the ability to simulate individual storms.
The simulations, which required a year to run, were performed at the NCAR-Wyoming Supercomputing Center, on a system known as Yellowstone. Prein and his co-authors used the new dataset to investigate changes in downpours over North America.
The researchers looked at how storms that happened between the years 2000 and 2013 might change if they occurred in a climate that was warmer by 5 degrees Celsius (9 degrees Fahrenheit) -- the temperature increase expected by the end of the century if greenhouse gas emissions continue unabated.
Prein cautioned that this approach is a simplified way of comparing present and future climate. It does not reflect possible changes to storm tracks or to weather systems associated with climate change.
The advantage, however, is that scientists can more easily isolate the effect of additional heat and associated moisture on future storm formation.
"The ability to simulate realistic downpours is a quantum leap in climate modeling," Prein said. "This enables us to investigate changes in hourly rainfall extremes that are related to flash flooding for the very first time. To do this took a tremendous amount of computational resources."

Effects vary

The scientists anticipate that the number of summertime storms producing extreme precipitation will increase across the entire country, although the amount varies by region.
The Midwest, for example, could have an increase of nearly 100 percent across swaths of Nebraska, the Dakotas, Minnesota, and Iowa. But the Gulf Coast, Alabama, Louisiana, Texas, New Mexico, Arizona, and Mexico could see increases ranging from 200 percent to more than 400 percent.
The study also found that the intensity of extreme rainfall events in summer could increase across nearly the entire country, with some regions, including the Northeast and parts of the Southwest, seeing particularly large increases -- in some cases more than 70 percent.
A surprising result, the scientists said, is that extreme downpours could also increase in areas that are getting drier on average, especially the Midwest.
Researchers expect the moderate rainfall events that serve as this region's major source of moisture during summer to decrease significantly, while extreme events will likely increase in frequency and intensity. This shift from moderate to intense rainfall could increase the potential for flash floods and mudslides, and would have effects on agriculture.
"Understanding how climate change may affect the environments that produce the most intense storms is essential because of the significant impacts these kinds of storms have on society," Prein said.
The study was also funded by the Research Partnership to Secure Energy for America.
-NSF-

Media Contacts Cheryl Dybas, NSF, (703) 292-7734,
cdybas@nsf.gov
Laura Snider, NCAR, (303) 497-8605,
 lsnider@ucar.edu


The National Science Foundation (NSF) is an independent federal agency that supports fundamental research and education across all fields of science and engineering. In fiscal year (FY) 2016, its budget is $7.5 billion. NSF funds reach all 50 states through grants to nearly 2,000 colleges, universities and other institutions. Each year, NSF receives more than 48,000 competitive proposals for funding and makes about 12,000 new funding awards. NSF also awards about $626 million in professional and service contracts yearly.
 Get News Updates by Email 
Useful NSF Web Sites:
NSF Home Page:
https://www.nsf.gov
NSF News:
https://www.nsf.gov/news/
For the News Media:
https://www.nsf.gov/news/newsroom.jsp
Science and Engineering Statistics:
 https://www.nsf.gov/statistics/
Awards Searches:
https://www.nsf.gov/awardsearch/
Summer storms that produce extreme downpours could increase by 400 percent across parts of the U.S.
Credit and Larger Version
Extreme downpours could increase flooding like that in Boulder, Colorado, in 2013.
Credit and Larger Version
Such extreme rainfall events result in widespread risks to infrastructure, such as roads.
Credit and Larger Version
The Boulder, Colorado, flooding of 2013 resulted in risks to life and property.
Credit and Larger Version
Highway to nowhere: Traffic along a road near Islip, New York, is stalled by heavy rains.
Credit and Larger Version
The National Science Foundation (NSF)
Guillermo Gonzalo Sánchez Achutegui
ayabaca@gmail.com
ayabaca@hotmail.com
ayabaca@yahoo.com
Inscríbete en el Foro del blog y participa : A Vuelo De Un Quinde - El Foro!

domingo, 23 de octubre de 2016

NSF : Soil moisture, snowpack data could help predict 'flash droughts' .- La humedad del suelo, los datos de la capa de nieve podrían ayudar a predecir 'sequías Flash'

https://www.nsf.gov/news/news_summ.jsp?cntn_id=190023&WT.mc_id=USNSF_51&WT.mc_ev=click


Severe 2012 drought could have been forecast months in advance, research shows

Flash droughts, like the one in the U.S. Southern Rockies and Midwest in 2012, can be predicted.

Flash droughts, like the one in the U.S. Southern Rockies and Midwest in 2012, can be predicted.
Credit and Larger Version

October 18, 2016
The "flash drought" that unexpectedly gripped the U.S. Southern Rockies and Midwest in the summer of 2012 could have been predicted months in advance using soil moisture and snowpack data, according to new research.
Scientists at the National Center for Atmospheric Research (NCAR) analyzed the conditions leading to the 2012 drought -- which resulted in $30 billion in economic losses -- looking for any warning signs that a drought was on the way.
In a study funded by the National Science Foundation (NSF) and published in the Journal of Geophysical Research-Atmospheres, the researchers found that observations of snowmelt and soil moisture could have forecast the ensuing drought up to four months in advance.
"Advance knowledge of a drought even a month or two ahead of time can greatly minimize the effects on society," said Anjuli Bamzai, program director in NSF's Division of Atmospheric and Geospace Sciences. "This study highlights the role of snowpack and soil moisture conditions in predicting the sudden onset of drought."
Seasonal drought forecasts issued in May 2012 for the upcoming summer did not foresee a drought forming in the country's midsection. But by the end of August, a drought that started in the Southern Rockies had spread across the Midwest, parching Oklahoma, Kansas, Nebraska and Missouri.
"The 2012 drought over the Midwest was one of the most severe and extensive U.S. droughts since the 1930s Dust Bowl, but it was also extremely challenging to predict," said Debasish PaiMazumder, lead author of the study. "This study demonstrated the potential to improve seasonal drought outlooks in the future, giving farmers, water planners, and others more time to prepare."
Flash droughts -- which form and intensify rapidly -- can catch forecasters off-guard because they are not preceded by any large-scale climate patterns that could act as warning signals.
For example, one contributor to the recent California drought was a persistent high-pressure system parked off the west coast that deflected storms away from the state. Because forecasters could identify the high-pressure system, they could also accurately predict fewer storms and a worsening of the drought.
Previous research showed that looking at soil moisture alone could improve the lead time of drought predictions by one to two months. PaiMazumder and NCAR colleague James Done were interested in whether they could extend this further by adding snowpack into the equation.
To explore the connections among snowpack, soil moisture and drought, the researchers analyzed data collected between 1980 and 2012. To supplement those observations, they also looked at the connections through a new NCAR-based community Weather Research and Forecasting (WRF) model dataset comprising 24 simulations from 1990 to 2000, and in 2012.
Because each simulation was run with small tweaks to the way the model represents atmospheric physics, the result was a broad look at different climate scenarios that could have plausibly unfolded during the study period.
"The model helped us get a handle on how robust the relationship is among snowpack, soil moisture and drought," Done said. "The stronger the relationship, the better the predictor."
While observations of snowpack and soil moisture could have helped forecast the 2012 drought, the method does not replace other drought prediction measures that identify large-scale phenomena that frequently lead to drought conditions.
"This is another ingredient that could be used when making seasonal drought forecasts," Done said.
-NSF-
Media Contacts Cheryl Dybas, NSF, (703) 292-7734,
 cdybas@nsf.gov
Laura Snider, NCAR, (303) 497-8605,

Related WebsitesNSF Grant: Collaborative Research: EaSM3 Integration of Decision-Making with Predictive Capacity for Decadal Climate Impacts: https://www.nsf.gov/awardsearch/showAward?AWD_ID=1419563&HistoricalAwards=false


The National Science Foundation (NSF) is an independent federal agency that supports fundamental research and education across all fields of science and engineering. In fiscal year (FY) 2016, its budget is $7.5 billion. NSF funds reach all 50 states through grants to nearly 2,000 colleges, universities and other institutions. Each year, NSF receives more than 48,000 competitive proposals for funding and makes about 12,000 new funding awards. NSF also awards about $626 million in professional and service contracts yearly.
Useful NSF Web Sites:
NSF Home Page:
https://www.nsf.gov
NSF News:
https://www.nsf.gov/news/
For the News Media:
 https://www.nsf.gov/news/newsroom.jsp
Science and Engineering Statistics:
 https://www.nsf.gov/statistics/
Awards Searches:
https://www.nsf.gov/awardsearch/
The 2012 flash drought hit Iowa farmlands hard, turning their once-green crops sere and brown.
Credit and Larger Version
Corn was among the crops affected by the 2012 flash drought.
Credit and Larger Version
With earlier drought warnings, farmers, water planners and others would have more time to prepare.
Credit and Larger Version
Scientists are using measures of soil moisture as a way of predicting flash droughts to come.
Credit and Larger Version
How deep is the snowpack? The answer may indicate whether a flash drought is on the horizon.
Credit and Larger Version
The National Science Foundation (NSF)
Guillermo Gonzalo Sánchez Achutegui
ayabaca@gmail.com
ayabaca@hotmail.com
ayabaca@yahoo.com
Inscríbete en el Foro del blog y participa : A Vuelo De Un Quinde - El Foro!

domingo, 19 de junio de 2016

NSF: Future summers could be hotter than any on record .- Los veranos futuros podrían ser más caliente que cualquier constancia

Hola amigos: A VUELO DE UN QUINDE EL BLOG., hemos recibido información de la Fundación Nacional de Ciencias de Los Estados Unidos, sobre el calentamiento del clima en los próximos años; NSF, NOS DICE: ... "Si el cambio climático continúa en su trayectoria actual, la probabilidad de que los veranos entre 2061 y 2080 será más caliente que el más caliente registrado se sitúa en el 80 por ciento a través de áreas de tierra del mundo, excluyendo la Antártida, que no fue estudiado.
Si se reducen las emisiones de gases de efecto invernadero, sin embargo, que la probabilidad se reduce a 41 por ciento.
"Veranos extremadamente calientes siempre suponen un reto para la sociedad", dijo el científico del NCAR Flavio Lehner, autor principal del estudio. "Ellos pueden aumentar el riesgo de problemas de salud, y también pueden dañar los cultivos y profundizar las sequías. Tales veranos son una verdadera prueba de nuestra capacidad de adaptación al aumento de las temperaturas."
El estudio es parte de un número especial de la revista Cambio Climático que se centrará en la cuantificación de los beneficios de reducir las emisiones de gases de efecto invernadero. La investigación fue financiada por la Fundación Nacional de Ciencias de EE.UU. (NSF) y la Fundación Nacional de Ciencia de Suiza................"
More information..........

Reducing carbon emissions could cut risk of record-breaking summertime heat in half

Heat waves effects
Heat waves affect energy use, farming and other aspects of society.
Credit and Larger Version
June 13, 2016
This is part 17 in a series on NSF's geosciences risk and resilience interest area. Please see parts one, two, three, four, five, six, seven, eight, nine, 10, 11, 12, 13, 14, 15 and 16.
In 50 years, summers across most of the globe could be hotter than any summer experienced by people to date, according to a study by scientists at the National Center for Atmospheric Research (NCAR) in Boulder, Colo.
If climate change continues on its current trajectory, the probability that summers between 2061 and 2080 will be warmer than the hottest on record stands at 80 percent across the world's land areas, excluding Antarctica, which was not studied.
If greenhouse gas emissions are reduced, however, that probability drops to 41 percent.
"Extremely hot summers always pose a challenge to society," said NCAR scientist Flavio Lehner, lead author of the study. "They can increase the risk for health issues, and can also damage crops and deepen droughts. Such summers are a true test of our adaptability to rising temperatures."
The study is part of an upcoming special issue of the journal Climatic Change that will focus on quantifying the benefits of reducing greenhouse gas emissions. The research was funded by the U.S. National Science Foundation (NSF) and the Swiss National Science Foundation.
 
Simulating a range of summers
 
The research team, which includes NCAR scientists Clara Deser and Benjamin Sanderson, used two existing sets of model simulations to investigate what future summers might look like.
They created both by running the NCAR-based Community Earth System Model 15 times, with one simulation assuming that greenhouse gas emissions remain unabated and the other assuming that society reduces emissions.
NSF and the U.S. Department of Energy fund the Community Earth System Model. The team ran the simulations on the NCAR-Wyoming Supercomputing Center's Yellowstone system.
"We've thought of climate change as 'global warming,' but it's important to understand how this overall warming affects conditions that hit people locally," said Eric DeWeaver, program director in NSF's Division of Atmospheric and Geospace Sciences, which funds NCAR.
"Extreme temperatures pose risks to people around the globe," DeWeaver said. "These scientists show the power of ensembles of simulations for understanding how these risks depend on the level of greenhouse gas emissions."
By using simulations created by running the same model multiple times, with only tiny differences in the initial starting conditions, the scientists could examine the range of expected summertime temperatures for future "business-as-usual" and reduced-emissions scenarios.
"This is the first time the risk of record summer heat and its dependence on the rate of greenhouse gas emissions have been so comprehensively evaluated from a large set of simulations with a single state-of-the-art climate model," Deser said.
The scientists compared results to summertime temperatures recorded between 1920 and 2014 and to 15 sets of simulated summertime temperatures for the same period.
By simulating past summers -- instead of relying solely on observations -- the researchers established a large range of temperatures that could have occurred naturally under the same conditions, including greenhouse gas concentrations and volcanic eruptions.
"Instead of just comparing the future to 95 summers from the past, the models give us the opportunity to create more than 1,400 possible past summers," Lehner said. "The result is a more comprehensive look at what should be considered natural variability and what can be attributed to climate change."
 
Emissions cuts could yield big benefits
 
The results show that between 2061 and 2080, summers in large parts of North and South America, central Europe, Asia, and Africa have a greater than 90 percent chance of being warmer than any summer in the historic record if emissions continue unabated.
That means virtually every summer would be as warm as the hottest to date.
In some regions, the likelihood of summers being warmer than any in the historical record remained less than 50 percent, but in those places -- including Alaska, the central U.S., Scandinavia, Siberia and continental Australia -- summer temperatures naturally vary greatly, making it more difficult to detect effects of climate change.
Reducing emissions would lower the global probability of future summers that are hotter than any in the past, but would not result in uniformly spread benefits. In some regions, including the U.S. East Coast and large parts of the tropics, the probability would remain above 90 percent, even if emissions were reduced.
But reduced emissions would result in a sizable boon for other regions of the world.
Parts of Brazil, central Europe, and eastern China would see a reduction of more than 50 percent in the chance that future summers would be hotter than the historic range. Since these areas are densely inhabited, a large part of the global population would benefit significantly from climate change mitigation.
"It's often overlooked that the majority of the world's population lives in regions that will see a comparably fast rise in temperatures," Lehner said.
-NSF-
Media Contacts Cheryl Dybas, NSF, (703) 292-7734,
cdybas@nsf.gov
Laura Snider, NCAR, (303) 497-8605,
 lsnider@ucar.edu


The National Science Foundation (NSF) is an independent federal agency that supports fundamental research and education across all fields of science and engineering. In fiscal year (FY) 2016, its budget is $7.5 billion. NSF funds reach all 50 states through grants to nearly 2,000 colleges, universities and other institutions. Each year, NSF receives more than 48,000 competitive proposals for funding and makes about 12,000 new funding awards. NSF also awards about $626 million in professional and service contracts yearly.
 Get News Updates by Email 
Useful NSF Web Sites:
NSF Home Page:
http://www.nsf.gov
NSF News:
 http://www.nsf.gov/news/
For the News Media:
http://www.nsf.gov/news/newsroom.jsp
Science and Engineering Statistics:
 http://www.nsf.gov/statistics/
Awards Searches:
http://www.nsf.gov/awardsearch/
How hot will future summers be? According to new research, a lot hotter than in the past.
Credit and Larger Version
heat waves
The summer of 2012, among others, was a scorcher. In 2012, three summer heat waves struck the U.S.
Credit and Larger Version
Heat Map of the US - June 29, 2012
June 29, 2012, was the hottest day that year in the eastern U.S.
Credit and Larger Version
The urban heat island effect
The urban heat island effect further raises summer temperatures in cities.
Credit and Larger Version
Grasses turn sere and brown in baking summer sun.
Credit and Larger Versión
the U.S. National Science Foundation (NSF)
Guillermo Gonzalo Sánchez Achutegui
ayabaca@gmail.com
ayabaca@hotmail.com
ayabaca@yahoo.com
Inscríbete en el Foro del blog y participa : A Vuelo De Un Quinde - El Foro!

domingo, 1 de mayo de 2016

NSF: Evidence points to widespread loss of ocean oxygen by 2030s .- La evidencia apunta a la pérdida generalizada de oxígeno del océano por la década de 2030....

Hola amigos: A VUELO DE UN QUINDE EL BLOG., hemos recibido información de la Fundación Nacional de Ciencias de Los Estados Unidos, sobre las evidencias de la pérdida de oxígeno en los océanos en el década del 2,030, nos dice: "El cambio climático ha provocado una caída en la cantidad de oxígeno disuelto en los océanos en algunas partes del mundo, y esos efectos debería ser evidente a través de grandes partes del océano entre 2030 y 2040, según un nuevo estudio dirigido por investigadores del Centro Nacional de Investigación atmosférica (NCAR) en Boulder, Colorado.Los científicos espera que el calentamiento global a los océanos de la savia de oxígeno, dejando de pescado, cangrejos, calamares, estrellas de mar y otras especies marinas luchando por respirar. Pero habían encontrado dificultades para determinar si esta fuga de oxígeno anticipado ya estaba teniendo un efecto notable."La pérdida de oxígeno en los océanos es uno de los efectos secundarios graves de calentamiento de la atmósfera, y una amenaza para la vida marina", dijo el científico del NCAR Mateo largo, autor principal del estudio. "Dado que las concentraciones de oxígeno en el océano varía naturalmente dependiendo de las variaciones en los vientos y la temperatura en la superficie, que ha sido un reto para atribuir cualquier desoxigenación al cambio climático. Este nuevo estudio nos dice cuándo podemos esperar el efecto del cambio climático para abrumar a la variabilidad natural ".
More information.........

Deoxygenation due to climate change threatens marine life

crabs and fish on the bottom seafloor
Marine life moves much more slowly in a low-oxygen ocean.
Credit and Larger Version
April 27, 2016
Climate change has caused a drop in the amount of oxygen dissolved in the oceans in some parts of the world, and those effects should become evident across large parts of the ocean between 2030 and 2040, according to a new study led by researchers at the National Center for Atmospheric Research (NCAR) in Boulder, Colorado.
Scientists expected a warming climate to sap oceans of oxygen, leaving fish, crabs, squid, sea stars, and other marine life struggling to breathe. But they had encountered difficulties in determining whether this anticipated oxygen drain was already having a noticeable effect.
"Loss of oxygen in the oceans is one of the serious side effects of a warming atmosphere, and a major threat to marine life," said NCAR scientist Matthew Long, lead author of the study. “Since oxygen concentrations in the ocean naturally vary depending on variations in winds and temperature at the surface, it's been challenging to attribute any deoxygenation to climate change. This new study tells us when we can expect the effect from climate change to overwhelm the natural variability."
The study is published in the American Geophysical Union journal Global Biogeochemical Cycles. The research was funded by the National Science Foundation (NSF).
 
Cutting through the natural variability
 
The entire ocean -- from the depths to the shallows -- gets its oxygen supply from the surface, either from the atmosphere or from phytoplankton, which release oxygen into the water through photosynthesis.
Warming surface waters, however, absorb less oxygen. And, in a double whammy, the absorbed oxygen has a more difficult time traveling deeper into the ocean. That's because as water heats up, it expands, becoming lighter than the water below it and less likely to sink.
Thanks to natural warming and cooling, oxygen concentrations at the sea's surface change constantly -- and deeper in the ocean, those changes can linger for years or decades.
For example, an exceptionally cold winter in the North Pacific would allow the ocean surface to soak up a large amount of oxygen. Thanks to the natural circulation pattern, that oxygen would then be carried deeper into the ocean, where it might still be detectable years later as it travels along its flow path.
On the flip side, unusually hot weather could lead to "dead zones" in the ocean, where fish and other marine life cannot survive.
To cut through this natural variability and investigate the impact of climate change, the research team -- including Curtis Deutsch of the University of Washington and Taka Ito of Georgia Tech -- relied on the NCAR-based Community Earth System Model, which is funded by NSF and the U.S. Department of Energy.
“This study shows how far comprehensive Earth System Models have come in the effort to quantify, along with relatively sparse observations, large-scale changes in oxygen in the oceans due to both natural variability and climate change,” said Eric Itsweire, program director in NSF's Division of Ocean Sciences.
The scientists used output from a project that ran the model more than two dozen times for the years 1920 to 2100. Each individual run started with miniscule variations in air temperature. As the model runs progressed, those tiny differences grew and expanded, producing a set of climate simulations useful for studying questions about variability and change.
Using the simulations to study dissolved oxygen gave the researchers guidance on the degree to which concentrations may have varied naturally in the past. With this information, they could determine when ocean deoxygenation due to climate change is likely to become more severe than at any point in the modeled historic range.
The researchers found they could already detect deoxygenation caused by climate change in the southern Indian Ocean and parts of the eastern tropical Pacific and Atlantic basins.
They also determined that more widespread detection of deoxygenation caused by climate change would be possible between 2030 and 2040.
However, in some parts of the ocean, including areas off the east coasts of Africa, Australia, and Southeast Asia, deoxygenation caused by climate change would not become evident even by 2100.
 
Detecting a global pattern
 
The researchers also created a visual way to distinguish between deoxygenation caused by natural processes and deoxygenation caused by climate change.
Using the same model dataset, the scientists created maps of oxygen levels in the ocean, showing which waters were oxygen-rich and which were oxygen-poor. They found they could distinguish between oxygenation patterns caused by natural weather phenomena and the pattern caused by climate change.
The climate change pattern also became evident in the model runs around 2030, adding confidence to the conclusion that widespread deoxygenation due to climate change will become detectable around that time.
The maps could also be useful resources for deciding where to place instruments to monitor ocean oxygen levels in the future to get the best picture of climate change effects. Currently, ocean oxygen measurements are relatively sparse.
"We need comprehensive and sustained observations of what's going on in the oceans to compare with what we're learning from our models, and to understand the full effect of a changing climate," Long said.
-NSF-

Media Contacts Cheryl Dybas, NSF, (703) 292-7734, cdybas@nsf.gov
David Hosansky, NCAR, (303) 497-8611, hosansky@ucar.edu


The National Science Foundation (NSF) is an independent federal agency that supports fundamental research and education across all fields of science and engineering. In fiscal year (FY) 2016, its budget is $7.5 billion. NSF funds reach all 50 states through grants to nearly 2,000 colleges, universities and other institutions. Each year, NSF receives more than 48,000 competitive proposals for funding and makes about 12,000 new funding awards. NSF also awards about $626 million in professional and service contracts yearly.
 Get News Updates by Email 
Useful NSF Web Sites:
NSF Home Page:
 http://www.nsf.gov
NSF News:
 http://www.nsf.gov/news/
For the News Media:
 http://www.nsf.gov/news/newsroom.jsp
Science and Engineering Statistics:
 http://www.nsf.gov/statistics/
Awards Searches:
 http://www.nsf.gov/awardsearch/
mpa of the world showing the ocans and progressive declining oxygen levels
By the 2030s, declining oxygen levels will likely be evident in many of the world's oceans.
Credit and Larger Version
closeup image of a crab
How will species such as crabs fare in low oxygen seas? Scientists are working to find answers.
Credit and Larger Version
Dungeness crabs washed up on a beach in Oregon
Dungeness crabs washed up on a beach in Oregon after suffocating in low-oxygen waters.
Credit and Larger Version
dead fish floating in the water
In ocean waters with less oxygen, fish kills are common.
Credit and Larger Version
cod swiming in the ocean.
Declining cod stocks may be further threatened by waters with low oxygen.
Credit and Larger Version
The National Science Foundation (NSF)
Guillermo Gonzalo Sánchez Achutegui
ayabaca@gmail.com
ayabaca@hotmail.com
ayabaca@yahoo.com
Inscríbete en el Foro del blog y participa : A Vuelo De Un Quinde - El Foro!

viernes, 1 de abril de 2016

NSF : Press Release 16-032 .- Ocean temperatures predict U.S. heat waves 50 days out .- Las temperaturas del océano predijeron olas de calor de Estados Unidos 50 días fuera..............

Hola amigos: A VUELO DE UN QUINDE EL BLOG., La formación de un patrón distinto de las temperaturas superficiales del mar en el medio del Océano Pacífico Norte puede predecir un mayor riesgo de olas de calor del verano en la mitad oriental de los EE.UU. hasta 50 días de antelación.
El patrón es un contraste de más cálido que el promedio de agua procedentes de mares fríos en contra de lo normal. Cuando aparece, las probabilidades de que el calor extremo se huelga durante una semana en particular - o incluso en un día en particular - puede más que el triple, dependiendo de lo bien formado es el patrón.
Los hallazgos fueron publicados en la revista Nature Geoscience. El autor principal es el científico Karen McKinnon, del Centro Nacional de Investigación Atmosférica (NCAR) en Boulder, Colorado.
"Olas de calor del verano se encuentran entre los fenómenos meteorológicos más mortales, y pueden tener grandes efectos sobre la agricultura, el uso de energía y otros aspectos críticos de la sociedad", dijo McKinnon. "Si podemos dar a los planificadores urbanos y los agricultores un mano a mano que el calor extremo se encuentra en el camino, que podría ser capaz de evitar algunas de las peores consecuencias."
More information.........
Pacific pattern forms in advance of hot days in eastern U.S.

cars in traffic on a highway and a big sun
Scientists have found a way of predicting an increased chance of a summer heat wave.
Credit and Larger Version
March 28, 2016
This is part 14 in a series on NSF's geosciences risk and resilience interest area. Please see parts one, two, three, four, five, six, seven, eight, nine, 10, 11, 12, 13 and 15.
The formation of a distinct pattern of sea surface temperatures in the middle of the North Pacific Ocean can predict an increased chance of summer heat waves in the eastern half of the U.S. up to 50 days in advance.
The pattern is a contrast of warmer-than-average water coming up against cooler-than-average seas. When it appears, the odds that extreme heat will strike during a particular week -- or even on a particular day -- can more than triple, depending on how well-formed the pattern is.
The findings were published today in the journal Nature Geoscience. The lead author is scientist Karen McKinnon of the National Center for Atmospheric Research (NCAR) in Boulder, Colorado.
"Summertime heat waves are among the deadliest weather events, and can have big effects on farming, energy use and other critical aspects of society," said McKinnon. "If we can give city planners and farmers a heads-up that extreme heat is on the way, we might be able to avoid some of the worst consequences."
In addition to McKinnon, the research team includes Andrew Rhines of the University of Washington, Martin Tingley of Pennsylvania State University and Peter Huybers of Harvard University.
"This intriguing result has enormous practical implications," said Candace Major, program director in the National Science Foundation (NSF) Division of Ocean Sciences, which funded the research along with NSF's Division of Atmospheric and Geospace Sciences. "The potential for predicting the risk of dangerous heat waves more than a month in advance is very exciting. With more time to prepare, communities have a greater chance of avoiding the serious economic and health consequences of weather extremes."
 
A fingerprint on the ocean
 
For the study, the scientists divided the country into regions that tend to experience extreme heat at the same time. They then focused on the largest of the resulting blocks: a swath that stretches across much of the Midwest and up the East Coast, encompassing important agricultural areas and heavily populated cities.
The researchers looked for a relationship between global sea surface temperature anomalies -- waters warmer or cooler than average -- and extreme heat in the eastern half of the U.S.
A pattern popped out in the middle of the Pacific, above a point roughly 20 degrees north latitude. The scientists could find the particular configuration of ocean water temperatures, which they named the Pacific Extreme Pattern, not only when the eastern U.S. was already hot, but also in advance of that heat.
"Whatever mechanisms ultimately lead to the heat wave also leave a fingerprint of sea surface temperature anomalies behind," McKinnon said.
 
Improving seasonal forecasts
 
To test how well that activity could predict future heat, the scientists used data collected from 1,613 weather stations across the eastern U.S. between 1982 and 2015, as well as daily sea surface temperatures from the same time period.
The researchers defined extreme heat in the eastern U.S. as a summer day when the temperature readings from the warmest 5 percent of weather stations in the region were at least 6.5 degrees Celsius (11.7 degrees Fahrenheit) hotter than average. They only examined extreme heat during that region's 60 hottest days of the year: June 24 through Aug. 22.
The scientists "hindcasted" each year in the data set to see if they could retrospectively predict extreme heat events -- or the lack of those events -- during that year's summer.
At 50 days out, they were able to predict an increase in the odds -- from about one-in-six to about one-in-four -- that a heat wave would strike somewhere in the eastern U.S. during a given week.
For a particularly well-formed pattern, at 30 days out or closer the scientists were able to predict that a heat wave would strike on a particular day at odds of better than one-in-two.
This new technique could improve existing seasonal forecasts, which do not focus on predicting daily extremes. Seasonal forecasts typically predict whether an entire summer is expected to be warmer than normal, normal, or cooler than normal.
For example, the seasonal forecast issued for the summer of 2012 predicted normal heat for the Northeast and Midwest. But the summer ended up being especially hot, thanks to three major heat waves that struck in late June, mid-July and late July.
When the research team used the Pacific Extreme Pattern to hindcast 2012, they were able to determine as early as mid-May increased odds of extremely hot days occurring in late June.
The hottest day of the summer of 2012, as measured by the technique used for this study, was June 29, when the warmest 5 percent of weather stations recorded temperatures that were 10.4 degrees Celsius (18.7 degrees Fahrenheit) above average.
"We found that we could go back as far as seven weeks and still predict an increase in the odds of future heat waves," McKinnon said. "What's exciting about this is the potential for long-range predictions of individual heat waves that give society far more notice than current forecasts."
 
Looking ahead
 
Scientists don't yet know why the fingerprint of sea surface temperatures in the Pacific predicts heat on the East Coast.
It could be that the sea surface temperatures themselves kick off weather patterns that cause the heat. Or it could be that they are both different results of the same phenomenon, but one does not cause the other.
To learn more about how the two are connected, McKinnon is working with colleagues at NCAR to use sophisticated computer models to try to tease apart what's happening.
The study's findings also point to the possibility that the Pacific Extreme Pattern, or a different oceanic fingerprint, could be used to forecast other weather events far in advance, including cooler-than-average days and extreme rainfall events.
"The results suggest that the state of the mid-latitude ocean may be a previously overlooked source of predictability for summer weather," McKinnon said.
-NSF-
Media Contacts Cheryl Dybas, NSF, (703) 292-7734,
cdybas@nsf.gov
David Hosansky, NCAR, (303) 497-8611,
hosansky@ucar.edu


The National Science Foundation (NSF) is an independent federal agency that supports fundamental research and education across all fields of science and engineering. In fiscal year (FY) 2016, its budget is $7.5 billion. NSF funds reach all 50 states through grants to nearly 2,000 colleges, universities and other institutions. Each year, NSF receives more than 48,000 competitive proposals for funding and makes about 12,000 new funding awards. NSF also awards about $626 million in professional and service contracts yearly.
 Get News Updates by Email 
Useful NSF Web Sites:
NSF Home Page:
 http://www.nsf.gov
NSF News:
 http://www.nsf.gov/news/
For the News Media:
 http://www.nsf.gov/news/newsroom.jsp
Science and Engineering Statistics:
http://www.nsf.gov/statistics/
Awards Searches:
http://www.nsf.gov/awardsearch/
map of United States showing different temperatures in 2012
June 29, 2012, was the hottest day of the year in the eastern U.S.
Credit and Larger Version
map showing the Pacific region with highlight of area with abnormal temperatures
Sea surface temperature anomalies in the mid-latitude Pacific 50 days out from June 29, 2012.
Credit and Larger Version
heat map of the Chicago skyline
The summer of 2012 was a scorcher. Three heat waves struck the U.S.
Credit and Larger Version
Heat waves affect energy use, farming and other aspects of society.
Credit and Larger Version
Grasses become sere and brown in the baking summer sun.
Credit and Larger Version
The National Science Foundation (NSF)
Guillermo Gonzalo Sánchez Achutegui
ayabaca@gmail.com
ayabaca@hotmail.com
ayabaca@yahoo.com
Inscríbete en el Foro del blog y participa : A Vuelo De Un Quinde - El Foro!

Mi lista de blogs